Math 183 HW 5
Hello, dear friend, you can consult us at any time if you have any questions, add WeChat: daixieit
HW 5
Math 183
Fall 21
Follow closely the ’Hw guide’ under Files in the folder ’Course Contents’ on how to write, scan and submit your hw.
Details for full credit:
● On any problem involving R, you should include your code and output as part of your answer. You may take a screenshot of the code/output, or write it by hand.
● On any problem involving probability, remember to define any event that you decide to use to have full credit. For example, if at some point you write something like P(A) = 0.5, before that, you need to define what is A for you, such as ’Let A be the event that the first roll is even’. To be even more clear:
– Acceptable: Let A be the event that the roll is even. Then P(A)=0.5.
– Unacceptable: P(A) = 0.5 or P(even) = 0.5.
● On any problem involving random variables, remember to define any random variable that you decide to use to have full credit. For example, if at some point you write something like E(X), before that, you need to define what is X for you, such as ’Let X be the number of exercises I have on a random week’. To be even more clear:
– Acceptable: Let X be the number of exercises I have on a random week. Then E(X)=5.
– Unacceptable: E(X) = 5 or E(exercises) = 5.
● If you use one of the distribution learned in class, to give a complete picture, you need to specify all the parameters. For example, X ~ B(n, p) does not completely specify the distribution of X but X ~ B(10, .5) does.
● Suppose a RV X follows a known distribution, such as X ~ B(10, .5) and you need to compute probabilities such as P(X ≤ 1). If the exercise states ’Compute your answer both by hands and using R’, it means that you should do both the following:
– P(X ≤ 1) = P(X = 0) + P(X = 1) =
+
= ..... ≈ 0.011
– In R ’pbinom(1,10,.05)’ gives me approximately 0.011
● Suppose a RV X follows a normal distribution, such as X ~ N(0, 0.5) and you need to compute probabilities such as P(X ≤ 1). If the exercise states ’Compute your answer using both the table and R.’, it means that you should do both the following:
– P(X ≤ 1) = P(Z ≤
) = P(Z ≤ 2) = 1 − P(Z > 2) = 1 − P(Z < −2) = 1 − 0.0228 = 0.977 where you find the probability using the table. You do not need to attach the table.
– In R ’pnorm(1,0,0.5)’ gives me approximately 0.977
If nothing is specified, you are free to choose between the two methods.
● Suppose a RV X follows a normal distribution, such as X ~ N(0, 0.5) and you need to compute probabilities such as P(X ≤ 1). If the exercise states ’Compute your answer using both the table and R.’, it means that you should do both the following:
– P(X ≤ 1) = P(Z ≤
– In R ’pnorm(1,0,0.5)’ gives me approximately 0.977
● When you conduct an HT remember to lay down all the necessary steps shown in class:
– Define the parameter/s and the hypotheses.
– Name the test you intend to conduct.
– State and check the assumptions needed.
– Define the test statistic, its sampling distribution under the null and the value it takes in your sample.
– Compute the p-value.
– Make a conclusion. Beside saying if you reject or you fail to reject the null write a meaningful conclusion such as ’It seems that the proportion of people that dresses up for halloween is actually .80’.
● When you construct a CI remember to lay down all the necessary steps shown in class:
– Define the parameter/s of interest.
– Name the interval you intend to construct.
– State and check the assumptions needed.
– Compute the bounds of the CI.
– Write a concluding statement that helps people understand how to make sense of your interval.
1 Exercise 1
In Spring of 2020 everyone was very excited because of the bioluminescence waves that were hitting the coast of San Diego. Your friend was interested in knowing the average size of the waves and he collected a lot of measurements. You try to construct a confidence procedure to capture the average size.
a) If the wave’s size is uniformly distributed with a = 0 and b = 2, and X is the size of the tenth wave your friend saw, what confidence level the confidence procedure [X, 2] has?
b)Check part a) performing simulations in R: generate 1000 sample and compute for each sample the confidence interval. Then look at the proportion of the confidence intervals that contains the true parameter.
c) Suppose now that, the waves’ size follows a continuous distribution with density function:
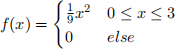
From now on until the end of this problem you will assume this distribution for the waves’ size. You see two waves, you record the two sizes, X1 and X2. If X1 ≤ X2 you give your friend the confidence interval [X1 − 0.1, X2 + 0.1], if X2 < X1, you give your friend the confidence interval [X2 − 0.1, X1 + 0.1]. What is the confidence level of this confidence procedure?
d) Suppose you observe 50 waves and you write down their sizes. Given your data, what would be a good point estimator for the parameter of interest?
e) Find its sampling distribution? (Find the shape and the parameters of the distribution)
f) Let’s call S the statistic proposed in part d). If now you want to construct a confidence procedure of the form (S-a,S+a), what a you should choose such that you have a procedure with 95% confidence level? Here don’t just guess and check but find a through a clear mathematical reasoning. Use the table.
2 Exercise 2
For each of the below settings, set up an hypothesis test (Define the parameter/s and the hypotheses).
a) Your friend claims that the probability a random college student in USA prefers in person lectures is 0.5. However you think that such proportion is larger.
b) You are curious to know if the average monthly revenue of your favorite restaurant dropped during Covid.
c) You read online that the heights of young men follow a Normal distribution with mean 69.3 inches and standard deviation 2.8 inches. You are curious to know if the spread of the distribution is actually 2.8.
3 Exercise 3
You are playing with your friend with an unfair die. When you play you roll the die 20 times and you win if you get more than 10 even numbers. Your friend thinks that the die gives you an even number with probability 1/3. You are more confident than him and you think that the die gives you an even number with an higher probability.
a) Set up an hypothesis test (Define the parameter/s and the hypotheses)
b)If your friend is right, how strange would it be to win at least 10 times when you play the game 30 times? You can use R to compute the probabilities you need.
c) Suppose that you play the game 30 times and you win 13 times. Which of the two hypotheses set up in part a) you are more confident in believing?
4 Exercise 4
You are curious to know what proportion of people that live in California prefers In-N-Out to McDonald. Your classmate believes that 70% of people prefers In-N-Out but you think they are wrong. You and your classmate decide to conduct an hypothesis test with significance level α = 0.03 to decide who is correct. You interview 1000 random people that live in California.
a)If 690 people claim to prefer In-N-Out, conduct an hypothesis test. Compute your answer using both the table and R.
b)Because you hate to be wrong you decide to cheat and to make up a number of people that would claim to prefer In-N-Out. What are all the possible numbers of In-N-Out’s fan that would result in a rejection of your friend claim? Compute your answer using both the table and R.
c) Let’s go back to the truth (690 people claim to prefer In-N-Out).You decide now to be a little bit more careful and to conduct the test with a smaller level of significance, α = 0.01. Does your conclusion from part a) change?
d) If 690 people claim to prefer In-N-Out, find an approximate 85% CI for the percentage of people that prefers In-N-Out to McDonald.
e) Suppose I plan to repeat the study and to interview n people. How large should n be if I want an approximate 85% CI whose MOE is (at most) 2%? Use the result from the first study to help you plan the new sample size. Here don’t just guess and check but find n through a clear mathematical reasoning. Use R to find the right quantile and do not round numbers until you get to the final answer.
f) Suppose that you don’t have anymore available the result from the first study. How the answer to part e) would change? Use R to find the right quantile and do not round numbers until you get to the final answer.
2021-11-10