GLBH0031 - Modelling for Decision Science - Assessment 2023
Hello, dear friend, you can consult us at any time if you have any questions, add WeChat: daixieit
GLBH0031 - Modelling for Decision Science - Assessment
April 2023
Instructions: Read every question carefully. Answer with as much detail as possible. Upload your answers, including all manual calculations. Upload the Jupyter notebooks that you create to answer the questions that require coding.
Question 1 [25 marks]
Part A
Let S, I and R be respectively the number of individuals in a population (of size N) that are susceptible, infectious and recovered from a disease. Let β be the infection rate and γ the recovery rate. Our SIR Model is given by:
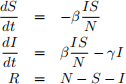
Suppose that we have a population of 6,000 people. On Day 0, 1 person gets infected. Suppose that, from the very beginning, somehow we know that the mean infectious period is 14 days and that the basic reproductive number is 4.2. On Day 0, you are hired by the government to answer the following questions, all based on the above model. Write (and upload) code in Python to help you answer them.
1. Provide a plot of the evolution of the number of susceptible, infected and recovered indi-viduals in the population for the next year. [4 marks]
2. What will be the maximum number of infected people (round your answer to 2 decimal places) and in how many days will this maximum be reached? [8 marks]
3. Suppose instead that the basic reproductive number is 1.2. What would be the maximum number of infected, and in how many days will it be reached? [8 marks]
Part B
1. For the following examples, identify whether they belong to supervised, unsupervised or reinforcement learning. [0.5 marks each]
(a) An algorithm that distinguishes customer preferences by tracking the films they view.
(b) Trying to predict the weather using historical data of temperature, humidity and precipitation.
(c) A programme that identifies the most important features that will determine if a patient has a medical condition or not.
(d) Creating a programme that learns how to play a certain video game.
(e) Detecting automatically whether an X-ray image corresponds to a certain class of tumour.
(f) Forecasting the price of houses next year based on historical data.
2. Explain whether each of the following scenarios is a classification or a regression problem. Also, for each one, name 3 variables or features for which you would have to collect data to train an ML algorithm. [1 mark each]
(a) Predicting the salary of the provost of a UK university.
(b) Predicting the success or failure of a new consumer product.
Question 2 [25 marks]
Part A
In the lecture, we learned that a classification algorithm for decision trees aims at minimising either the entropy or the Gini index. Suppose you have 2 classes. Let  is the proportion of training observations in the m-th region that belong to the 1st class.
1. Write a Python function that takes as its only input and computes the value of the Gini index. [3 marks]
2. Write a Python function that takes as its only input and computes the value of the entropy. Hint: be careful with the range of values that the input can take. [3 marks]
3. Produce a plot that shows, in the same graph, both the Gini index and the entropy for the full range of values of . Add details to your plot, such as labels, and clearly identify both curves. [4 marks]
Part B
Download the data in the file pets.csv from Moodle. The data set contains the results of the London Pet Owner Census 2019. It reports the type of animal owned as a pet per every 1,000 households.
1. Read the file using pandas, and create a dataframe where the unnamed column is renamed “Borough” and which does not contain the column “Hamsters”. [3 marks]
2. Using hierarchical clustering with complete linkage, cluster the boroughs and plot the resulting dendrogram. Make your plot as informative as possible, where each leaf displays the name of the corresponding borough. Hint: you can use the methods dendrogram and linkage, imported from scipy.cluster.hierarchy. [7 marks]
3. Explore the effect of standardising the data, that is, transforming it such that the mean of each column is 0 and the standard deviation of each column is 1. Why would this be convenient for your analysis? Modify the code to show 3 different clusters. [5 marks]
Question 3 [25 marks]
Part A
Consider the following set of observations (x independent variable; y dependent variable):

Apply linear regression analysis to find a line that best fits the observed data:
1. Write the hypothesised model. [2 marks]
2. Write the normal equations in matrix form (with numbers). [4 marks]
3. Solve the normal equations to determine the unknown model parameters. [4 marks]
4. Draw a plot representing the observed data and the fitted line, clearly labelling it. [3 marks]
Part B
Your friend is a hospital manager and he is trying to predict patient’s treatment costs de-pending on their length of stay (estimated at time of arrival) at the hospital. He wrote you saying that he has implemented a machine learning algorithm to do that, however he thinks something is not working properly.
He had access to a dataset formed of 100 pairs of observations {length of stay; treatment cost} from patients who stayed at the hospital during the previous year. He sampled 10 of those observations and used linear regression to fit the data with a polynomial function. He decided to use a polynomial of degree 9 as it results into a curve that passes exactly through each of the 10 data points.
Here is the plot he sent you: [continues to the next page]
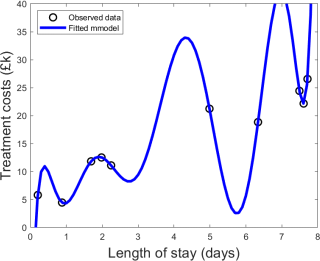
He also wrote he would not feel comfortable using the obtained fitted model to predict treatment costs based on length of stay for future patients.
Giving as much detail as possible, explain what is wrong with your friend’s approach and describe a more appropriate approach. Please report all relevant mathematical formulas and do feel free to complement your explanations with drawings. No word limit. [12 marks]
Question 4 [25 marks]
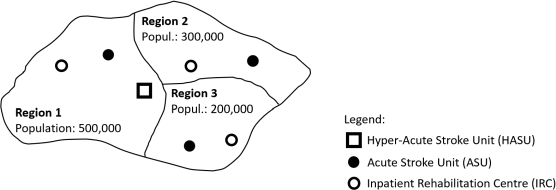
A stroke service provider covers the area depicted in the figure below.
Stroke services are organised as follows:
• Patients suffering from stroke are immediately treated at the Hyper-Acute Stroke Unit (HASU). There is one HASU treating all patients from the three regions. There are 11 beds at the HASU. On average, a patient spends 2 days in a HASU bed before being referred to an Acute Stroke Unit (ASU).
• Each region has its own ASU, therefore each patient is sent to the ASU located in the region where they live. Each ASU has 13 beds. On average, a patient spends 5 days in an ASU bed. After their stay at ASU, patients are referred to an Inpatient Rehabilitation Centre (IRC).
• Similarly to the ASU, each region has its own IRC and patients are referred to the one in the region where they live. Average stay at IRC (bed occupied) is 10 days for a patient. IRC’s beds are currently {28, 16, 16} for Regions {1, 2, 3}, respectively.
Further data/assumptions:
• Patients arrive at the HASU at a rate of 150 patients/month.
• We can assume that stroke patients belong to each region proportionally to region’s pop-ulation.
• Service times and inter-arrival times are Exponentially distributed.
Motivating your answers and giving as much detail as possible (no word limit):
1. Describe how you would model the above system as a network of queues and draw a diagram denoting: capacities, service times and arrival rates at each centre, as well as patient flow (through arrows) between centres. [6 marks]
2. Quantify the level of resource utilisation at each centre given the current capacities. [5 marks] [continues to the next page]
3. Redistribute beds across the network to achieve a maximum traffic intensity of 0.85 at all centres. [6 marks]
4. For both cases (current capacities and redistributed beds), estimate how long a patient will spend from their arrival at HASU until their discharge from IRC and briefly comment on the results obtained. [8 marks]
2024-04-10