BU.450.760 Assignment 1: Blue Apron CLV
Hello, dear friend, you can consult us at any time if you have any questions, add WeChat: daixieit
BU.450.760
Assignment 1: Blue Apron CLV
Considet the dataset D2.3, which contains simulated transactional data inspired by the subscription meal delivery service Blue Apron (https://www.blueapron.com/). The dataset records a random sample of Blue Apron’s subscribers’ activity ( ∼22,400 individuals) during Jan 2019. A detailed codebook is available from the document C2.3.
Consider the following two specifications:
Specification 1:
y = f(β0 + β1Tenure + β2Rating + β3partysize + β4 urban + (plan menu and frequency factors))
Specification 2:
y = f(β0 + β1 Tenure + β2Rating + β3 partysize + β4 urban + (plan menu and frequency factors) +
β5 Rating × partysize + β6Rating × urban + β7partysize × urban + β8 urban × Tenure)
Using the Blue Apron data, perform the following tasks:
1. Task 1:
a. [20 points] Estimate the two listed specifications using churn indicator as the outcome and implementing f as the logistic model.
b. [10 points] Select a model based on predictive performance criteria. Justify your decision.
c. [10 points] Use the selected model to predict churn probabilities for every customer in the sample. Present a histogram of these probabilities.
2. Task 2:
a. [20 points] Estimate the two listed models using MonthlyAddons as the outcome and implementing f as linear regression.
b. [10 points] Select a model based on predictive performance criteria. Justify your decision.
c. [10 points] Use the selected model to predict MonthlyAddons for every customer in the sample. Make sure these predictions are within range. Present a histogram thereof.
3. Task 3:
a. [10 points] Export the full dataset to a csv file. The exported data must include individual predictions for churn probabilities (task 1) and monthly add-ons (task 2), each from their respectively preferred specification. After this file is saved as csv, convert it into xls or xlsx so that formulas can be saved (this last step is not in R, just a simple change of extension).
4. Task 4: consider the following policy currently being evaluated by BA’s leadership: by making a one-time $20 expenditure on each targeted customer (eg, mailing a gift Champaign bottle), BA can reduce each targeted customer’s probability of churn by 0.01.
a. [15 points] Compute baseline CLV values for each customer in the initial scenario (i.e., if the new policy was not implemented).
b. [15 points] Determine the optimal targeting policy with unlimited budget. This is, determine the set of customers who the firm should send the one-time gift to. How many customers does the firm target?
c. [10 points] Compute the total financial gains/losses derived from implementing the campaign as the before/after difference between the total CLV values in the entire portfolio of customers. (Note: your calculations should account for targeting costs.)
Guidance
. Use a 70/30 training/validation data split
. For CLV calculations use the formula used in class,
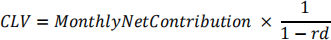
where:
o MonthlyNetcontTibution = (MonthlybasePayments +
PTedicted addons) × 0.3 (that is, the firm has a 30% margin)
o Retention rates vary individual by individual, as reflected by predicted churn
o Periods are months and the discount factor is d = 0.98
Submission guidelines
. Submit via Blackboard, 30 mins before the start of class 3
o Late submissions will be penalized
o Late corrections will not be accepted
. Note that assignments are automatically checked for similarity—it is ok to discuss with other students, it is not ok to copy
. Submit 3 files (one submission per group is enough):
1. MS Powerpoint
. Slides must: (i) describe results (ii) provide written answers to questions when necessary (iii) describe reasoning behind key steps.
. Use as many slides as you need.
. The title page must include the name of all participating students (if names are not listed, it will be assumed only the submitting student participated).
2. R script file containing the codes that you used for your analysis of tasks 1-3. Include comments that make it easier for the TA to follow your procedures.
3. Excel file used for task 4. Include comments that make it easier for the TA to follow your procedures.
. In the ppt file, I expect you to present results in an executive way, ie, in a way that makes it easy for the TA to understand what you did, why you did it (rationales), and what you obtained. The ppt is also the instance where you provide a formal (ie, written) answer to the formal assignment requirements. The script file should be understood as a companion, which TAs can go and check to make sure that your answer in the ppt are well supported.
2024-04-08