BIOL5177 - RNA - SEQ AND NEXT GENERATION TRANSCIPTOMICS
Hello, dear friend, you can consult us at any time if you have any questions, add WeChat: daixieit
BIOL5177 - RNA - SEQ AND NEXT GENERATION TRANSCIPTOMICS
18th April, 2024
Assessment of single cell analysis and interpretation
The aim of this task is to repeat a single cell analysis and subsequent interpretation of the data and results, as introduced in the lecture and performed in several practical sessions. First, you will quality control data (i) looking at the mapped reads of some 10X Chromium data (ii) and by evaluating the 10X CellRanger summary output. Next, you will work on a 10X Chromium dataset of a γδ T cell dataset with three wild type (WT) samples and one knock out
(KO). The KO is from a β2 integrin deficient mouse. Your task will be to generate an analysis pipeline in Python, perform quality control of the samples, integrate the data with different methods, annotate the different clusters, perform differential expression analysis with two tools, build a trajectory and interpret the results. The data can be found at: /data/BIOL5177/Assessment/
Directories for the Task3: KO1/ WT1/ WT2/ WT3/
Task 1: Analyse the mapping quality: Please discuss the quality of the mapped reads from a 10X Chromium run. Please explain in less than 150 words, why you think it is a good or bad run.
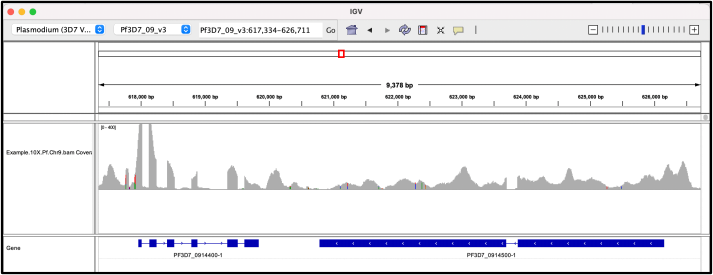
Figure 1: IGV view of 10X Chromium mapping of reads of a Plasmodium falciparum genome. The blue boxes represent genes. The top plot is the coverage plot.
Task 2: Quality control of data: Look at the output of a random Cell Ranger below. Answer the three questions in less than 150 words:
Is this a good single cell run?
How could it be improved?
What needs to be considered for its downstream analysis?
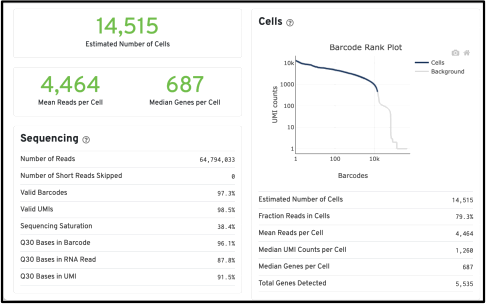
Figure 2: Output of Cell Ranger of a run.
Task 3: Perform an integration analysis in ScanPY of the two conditions (WT & KO). As completed in the
practicals Seurat is the R implementation of single cell analysis. For this task you will instead use ScanPY the Python implementation. The read matrices for ScanPY are in the subdirectory KO1 WT1 WT2 WT3. The implementation MUST be in Python.
(a) Perform the standard ScanPy analysis pipeline. Explain in few words your choice of dimension reduction and cluster resolution parameters.
(b) Generate a UMAP and annotate the three largest clusters. Exclude small clusters that might be noise and are not γδ T cells. (There might not be known clusters, so use the top marker genes for the annotation. Hint: Use the “subset” command to filter away noise)
(c) Plot the frequency of cell types in the clusters – what does that tell you about knock out? (~100 words) (d) Perform differential expression (DE) in the (largest) cluster that contains cells from the KO and the
WT. How many genes are up-regulated in the KO with a corrected p-values <0.01 and logFC >0.5?
(e) Change the integration of the four samples from BBKNN method to Harmony. Repeat the DE expression analysis and note many genes are up-regulated in the KO with a corrected p-values <0.01 and logFC >0.5?
(f) Perform DE by doing a pseudo bulk approach (this is calculated by taking the average expression of all the cells per cluster for each sample and then applying a bulk RNA-Seq DE method like DESeq2 to perform the DE analysis) of the output of (d) and (e) and report how many genes are up-regulated in the KO. Think about a good cut-off – why did you chose the cut-off? Generate a summary figure to compare the 4 different lists of genes and discuss (<200 words) which methods might be the best and why.
Task 4: Perform a pseudo-time trajectory of the main clusters of the integrated data using PAGA. Generate a pseudotime trajectory with the PAGA package. Use an adequate dimension reduction representation to plot your trajectory with the cells. Discuss in around 200 words the shape of the trajectories, if it makes “biological” sense; Speculate on the direction of the trajectory and what it could tell you.
Task 5: State in less than 150 words, if the γδ T cell experiment has a good experiment layout, how it could be improved and if the result could be relevant for the community.
You have to submit two documents :
1. A notebook (Jupyter or other) as pdf with all the code, comments and the generated figures. To each Python command block, add the equivalent command you would use in R as a comment and comment in one-three sentences what it does. 25% of the grade is for the programming code and 25% for the documentation.
2. A pdf with the answer of the different task, and the requested figures (50% of grade).
Both documents should have your student ID as name (points taken away if not done) and submitted through Moodle at the indicated deadline.
Your grade for this assignment will be worth 50% of your final grade for this 20 credits course.
Formatting notes
. Include all the commands used to that generate the results and figures in the notebook.
. Figure for the second document (answering the task): Annotate them well, e.g., title, axis labels and include key information like the number of upregulated genes that were used to generate a figure (legends don’t
count toward the word limits). Write some sentences alongside the plot (word limit within tasks) as a short description and interpretation of the performed analysis.
. The exercise can be performed on the tdo-summerschool server or on your local machine
Evaluation
A good performance includes well annotated figures with a concise description of the data and the results and a succinct interpretation. Code needs to be commented. The reader should be able to understand the figure without other information. Include why specific cut-offs were chosen, e.g., Significance level for differential expression analysis, or number of clusters.
Code should be nicely structured and not repetitive (e.g. use loops where possible). It should be well documented, include the equivalent code from Seurat, and each code section should have 2-3 lines (2-3 sentences) explaining in your own words, what the code is doing.
2024-04-06