MATH6147 Spreadsheet Modelling Coursework
Hello, dear friend, you can consult us at any time if you have any questions, add WeChat: daixieit
MATH6147 Spreadsheet Modelling Coursework
Excel Assignment:
You have been asked to design a spreadsheet that helps to answer two questions.
1. Where should vaccination centres be located in order to reach as many people as pos-sible? There is a limited budget and this must be used to cover the staff costs and the set up costs for the centres. The location of the centres is important as people are less likely to travel a long distance for a vaccination and the objective is to vaccinate as many people as possible. Answering this question will involve carrying out an optimisation.
2. How many hours of staff time should be allocated to vaccination centres to account for the randomness in the number of arrivals each day? If the arrival process is random, as it is in this example, then using average demand to estimate the number of staff needed does not always give the right solution. Answering this question will involve carrying out a simulation.
The administrators of the vaccination centres would like a spreadsheet that considers different locations for the vaccination centres and to carry out a simulation to investigate the impact of uncertainty on the number of staff hours needed. The spreadsheet should be designed to be easy for someone else to use and experiment with and should output results in a clear and attractive way.
Optimisation Model
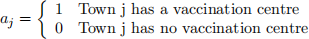
We assume that the probability of a person in town i visiting town j for a vaccination (i, j = 1, . . . , N) is dependent on the distance between towns i and j, dij, and whether town j has a vaccination centre. Note that vaccination centres can only be set up in towns. We use the variable aj to denote whether town j has a vaccination centre such that
We use a multinomial logit model to estimate the probability that a person in town i will have a vaccination in town j. This is a common model to use to describe how people choose between a set of discrete options. Essentially, it assumes that customers will choose the option that maximizes their utility. We assume that the deterministic part of the utility for a person living in town i and choosing whether to have a vaccination in town j is β0 − β1dij. Here, β0 is the utility when the vaccination centre is in the same town, and β1 dictates the impact of the travel distance on a person’s probability of having the vaccination.
Combining the multinomial logit model with the availability of vaccine centres, the probability that a person in town i has a vaccination in town j is given by Pij where
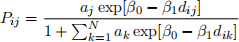
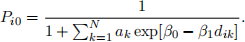
and the probability that a person in town i has no vaccination is equal to
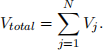
The total expected number of people vaccinated in centre j is given by
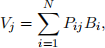
where Bi is the population of town i, and the total number of people vaccinated for all towns in the region is
The choice of where to place vaccination centres is constrained by the total cost,
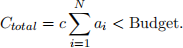
Here, we only consider the cost of centres, which is equal to the total number of centres that are used, multiplied by the cost per centre c.
Simulation Model
Each centre will be open for a total of T days to complete vaccinations (we assume that each centre is open for the same number of days) and we anticipate that the demand for vaccinations will be constant over the time period. Therefore, the average number of people arriving at vaccination centre j per day is

We can assume that the actual number of arrivals per day at vaccination centre j follows a normal distribution with mean mj and standard deviation  (for those of you who are interested, we are assuming that arrivals follow a Poisson distribution but we can use a normal distribution as an approximation because the rate parameter is relatively large).
A member of staff is able to vaccinate r people per hour. Therefore, if Hj hours of staff time are allocated to centre j per day, the centre will be able to vaccinate rHj people per day. The cost of employing a member of staff for one hour is s and so the total staff costs for centre j will be sHj per day.
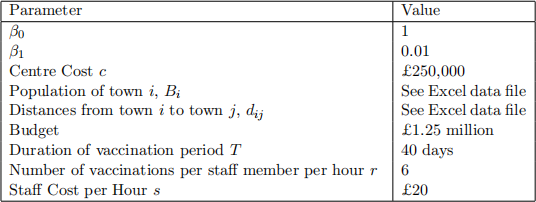
Parameters
The parameter values needed for solving this problem are given in the table and the distances between the 10 towns under consideration and their populations are given in an Excel file available for download from Blackboard.
Excel Tasks
1. Design and build a spreadsheet that calculates the total expected number of vaccinations completed and the total expected cost for the example data given in the accompanying spreadsheet, where the user is able to choose which towns are allocated a vaccination centre. The spreadsheet should be designed to be flexible so that it works easily for a new example. Your spreadsheet will be tested on a new example during the marking.
2. Using Solver, find the optimal locations for vaccination centres such that the expected number of vaccinations given is maximised and the total cost is within the allocated budget.
3. Using Excel’s built in random number generator, simulate the number of arrivals per day for 5 complete vaccination periods for each centre (5 replications of 40 days). Report the total number of people vaccinated, the average number of days in a vaccination period on which the number of arrivals is greater than the number of vaccinations that can be delivered, the average number of additional vaccinations per day, and any other statistics that you feel may be of interest to a decision maker. The user should be able to choose the number of staff hours per day at each centre.
4. Using the statistics output by the simulation, recommend the number of hours of staff time per day that should be allocated to each centre and state the total staff costs associated with your recommendation.
5. Write a report that details interesting results coming from the spreadsheet and includes the results of the analysis carried out in the previous tasks. The report should not include details of how to use the spreadsheet and, if any instructions are needed, then these should be included as part of the spreadsheet itself. Your report should not exceed 3 A4 pages.
General Restriction
Files with extension .xlsm will not be opened by the markers. (These are Excel files that include macros.)
What You Should Submit
● One Excel workbook, as described above.
● Report as described above.
Marking
The assignment will be marked out of 100 of which 30 marks will be awarded to the report and 70 to the spreadsheet. Marks for the report will be awarded for content, clarity and quality of presentation. Marks for the spreadsheet will be awarded for accuracy, functionality (whether it follows the brief given above), clarity, usability and presentation.
Professor Christine Currie
2021-11-08