F78AP Algorithmic and Scientific Programming
Hello, dear friend, you can consult us at any time if you have any questions, add WeChat: daixieit
F78AP Algorithmic and Scientific Programming
F78AP 2021-22
Assignment 1
This assignment consists of the following two tasks, which should be completed using R:
1. The least common multiple of integers m and n is the smallest integer k such that k is a multiple of m and k is a multiple of n.
Write R code to calculate the least common multiple of two integers m and n. Test your code by presenting your results for five pairs of values of m and n, where each pair is selected by running the R command rpois(2,lambda=100). Make sure you clearly state the values of m and n you have used as part of your report.
[10 Marks]
2. Let X1, X2, X3,… be a sequence of random variables, each taking either the value 0 or the value 1. We set X1 = 0, and then for n = 0, 1,… we choose the value of Xn+1 according to two different probability distributions, depending on the value of Xn. If Xn = 0, we let
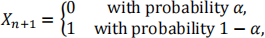
while if Xn = 1, we let
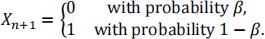
You should choose values for α and β by running the R command
runif(2,min=0.3,max=0.7)
Write R code which simulates observations from the random variables X1,…,X500 and calculates the proportion of these 500 observations which are equal to 0. Use a ‘for’ loop to run your R code many times, and plot a histogram of the results obtained.
Repeat your investigation for a different pair of values of α and β, again selected by running the R command above. Make sure you clearly state the values of α and β you have used as part of your report.
Hint: To simulate a coin toss that shows Heads with probability α and Tails with probability 1 - α, you can sample a Uniform U(0,1) distribution using the command runif(1), and then check whether this simulated value is less than α or not.
[10 Marks]
Notes
● This assignment counts for 20% of the course assessment.
● Your work on this assignment should be presented as a report covering both the above tasks. This report can be written in Microsoft Word or other appropriate software. For each task, your report should include
○ Your R code, which should be clearly laid out and include appropriate comments to help a human reader. This code can be pasted into your report from the software you use to run R.
○ The results of running your R code, including graphs, charts and/or tables as appropriate to present your data.
○ A logical structure, a brief statement of your main findings/conclusions, and other words as needed to make your report easily readable.
● Each of the above tasks will be marked according to the rubric given below.
2021-11-04