ECMT2130 – Tutorial 3
Hello, dear friend, you can consult us at any time if you have any questions, add WeChat: daixieit
ECMT2130 – Tutorial 3
Conceptual Questions
1) What does it mean for two events to be independent?
2) Provide two examples of discrete random variables and continuous ones.
3) What is the difference between a probability mass function (PMF) and a probability density function (PDF)? What is the difference between a PDF and a CDF?
4) Would one be able to find a derivative for the CDF of a discrete distribution?
5) Assuming share prices are a continuous variable, what is the probability of Woodside share price to be $40 next month?
6) Define expected value, both mathematically and in simple words.
7) What do we mean when we say a normal distribution is fully characterised by its mean and variance?
8) What does the kurtosis measure?
9) What is the skewness and kurtosis of a normal distribution?
10) What is the difference between error term and residuals in regressions?
11) What are the 5 essential assumptions for the OLS estimator to produce high-quality estimates in large samples?
12) What does it mean for an estimator to be unbiased?
13) What does it mean for an estimator to be consistent?
Numerical and Computation Questions
1) Consider a random variable Y equal to the sum of the outcomes of tossing three fair coins:
Y = x1 + x2 + x3
Where x1 is the result of tossing the first coin, x2 the second and x3 the third. Assume the general outcomes for each tossing follows:
For example, if the second throw results in Heads, thenx2 = 1.
a) What possible combination of values can (x1, x2, x3) assume in this experiment?
b) Find the distribution function ofY. This involves showing all the possible values for Y and the chance of observing each value.
c) Draw the probability mass function (PMF) and the cumulative mass function (CDF) of the random variable Y.
d) Find the expected value of Y andY2.
e) Find the variance and standard deviation ofY.
f) Find the skewness ofY. Hint: if you wish to calculate the skewness, use the fact that
E[g(y)] = ∑ Pr(y = yi ) ∗ g(yi ) applied to g(y) = [y − E(y)]3. Then, use the formula for the skewness from the lecture slides.
Does this skewness level make sense when analysing the PMF of Y?
g) Find the kurtosis ofY. Compare it to the kurtosis of a normal distribution.
2) Consider three return series with expected values and variances as in the table below:
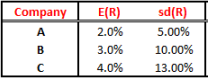
a) Calculate E(RA + RB + Rc ) and vaT(RA + RB + Rc ). Assume the returns are independent of one another.
b) Consider a portfolio with 20% weight on company A, 45% weight on company B and the remaining in company C? Assuming independence across the returns, calculate the mean and standard deviation of the portfolio.
c) How does your answer change if the weights were 30% for company A, 25% for company B and the remaining for company C? Which portfolio would prefer to buy and why?
d) Assume the same portfolio as in (c) but now with Cov(RA, RB ) = 0.03, Cov(RA, Rc ) = 0.04 and Cov(RB, Rc ) = −0.01. Which portfolio would you prefer now?
3) A marketing manager of a leading firm believes that total sales for the firm next year can be modelled by using a normal distribution with a mean of $2.5 million and a standard deviation of $300,000. You may want to use Excel to calculate the probabilities.
a) What is the probability that the firm’s sales will exceed $3 million?
b) What is the probability that the firm’s sales will fall within $150,000 of the expected level of sales?
c) In order to cover fixed costs, the firm’s sales must exceed the breakeven level of $1.8 million. What is the probability that the sales will exceed the breakeven level?
d) Determine the sales level that has only 9% chance of being exceeded next year.
4) Patrick wants to estimate the relationship between the average returns and risk (measured by the standard deviation of returns). He collects data for several share prices overtime and takes the average of them; he does the same for the standard deviation. He obtains one observation (one value for return and one for variance) for each company, so he is dealing with a cross section (not a time series).
He applies to OLS estimator to obtain the following results:

Both returns and standard deviation are measured in percentage. So, Ti = 4 means company ,‘s average return was 4%.
a) Interpret the estimate for the intercept coefficient. What does it suggest?
b) Interpret the estimate for the slope coefficient.
c) Plot line of best fit.
2024-03-21