APPLIED STATISTICS (MATH10096) Assignment
Hello, dear friend, you can consult us at any time if you have any questions, add WeChat: daixieit
SCHOOL OF MATHEMATICS
APPLIED STATISTICS (MATH10096)
Assignment
• To be uploaded to Gradescope by 4pm, March 22, 2024.
• This assignment is worth 20% of your final grade for the course.
• Assignments should be typed (LATEX, word, etc.).
• Answers to questions should be in full sentences and should provide all necessary details.
• Any output (e.g., graphs, tables) from R that you use to answer questions must be included with the assignment and should be formatted as part of the discussion (i.e., not copy and pasted from the console). Also, please include your R code in the assignment.
• You are welcome to discuss the questions with colleagues, but the solutions and code must be written independently.
• The assignment is out of 100 marks.
1. (13 marks) In the 2000 Presidential election in the U.S. with Democratic candidate Al Gore and Republican candidate George W. Bush, some political analysts thought that most of the votes in Palm Beach County, Florida, for the Reform party candidate, Pat Buchanan, may have actually been intended for Gore (whose name was next to Buchanan’s on the ballot) but wrongly cast for Buchanan because of the design of the “butterfly ballot” used in that county, which many voters found confusing. Bush won Florida by 537 votes and, with it, the Electoral College and the election. It is widely believed that voting irregularities in Palm Beach county cost Gore the presidency. More information can be found in Wikipedia
https://en.wikipedia.org/wiki/2000_United_States_presidential_election_recount_in_Florida
The BushGore dataset, available on Learn, contains the Florida county-wide votes for the Reform party candidates in 2000 (Buchanan) and in 1996 (Ross Perot). Using Perot’s votes in 1996 to predict Buchanan’s votes in 2000, investigate whether the observation for Palm Beach county impacts the results from such a (simple) linear regression model. Note: You can read the data in R by typing the below command.
elections <- read.table("BushGore.dat", header = TRUE)
2. The datasetteengamb in the package faraway concerns a study of teenage gambling in Britain. To know more about the variables in this dataset, please type help(teengamb).
(a) (5 marks) Fit a regression model with the expenditure on gambling as the response and the sex, socioeconomic status, income, and verbal score as predictors. Fit the same model, but now with the response variable being the square root of the expenditure on gambling. Why should the second model be preferred over the first model? Do you have any concerns regarding the second model? For the remaining questions, please use the square root of the expenditure as the response variable.
(b) (4 marks) With all other predictor variables held constant, what would be the estimated difference in the mean (square root) expenditure on gambling for a male compared to a female. Provide also a 95% confidence interval for this difference.
(c) (4 marks) Predict the amount that a male with socioeconomic status, income, and verbal score at the maximum values in this dataset would gamble, along with a 95% prediction interval. Take care to give your answer in the original units of the response.
(d) (4 marks) Fit a model with income just as a predictor, and use an F-test to compare it to the full model fitted in (a). State precisely the two models being compared. What does this tell you about the significance of the other three predictor variables?
(e) (6 marks) A modelselection strategy that is easily applied here is all possible subsets. Assuming sex must be included in all the models, fit all possible combinations of predictors. How stable is the estimated effect of sex across these models?
(f) (5 marks) Which of the models fitted in (e) would you select as your final one, and on what basis? What conclusions would you draw from this selected model?
3. The dataset butterfat in the package faraway contains the average butterfat content (percent- ages) of milk for random samples of twenty cows, ten two-year old and ten mature (greater than four years old), from each of five breeds. Therefore, for each combination of breed and age categories, there are ten observations. The data are from Canadian records of pure-bred dairy cattle. Questions of interest are (i) if butterfat content differs with age and/or breed, and (ii) if any potential breed effect is the same for the two age groups.
(a) (5 marks) Make appropriate plots of the data and comment on them.
(b) (13 marks) Determine an appropriate model, and write it down mathematically, to answer the questions of interest. What are your conclusions?
(c) (8 marks) Is the best breed in terms of butterfat content clearly superior to the second best breed? Justify.
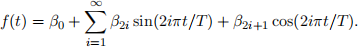
4. The data set cairo available in the package gamair contains the variables temp and time giving the mean daily temperature in Cairo on each day over a number of years (time runs from the start of the data, January 1st 1995, and temperature is in degrees Fahrenheit). The interest in these data is in establishing whether there is evidence for an increase in mean temperature. However, there is a clear annual cycle in the data,which will need to be modelled, if one is to hope to detect any overall change in mean temperature (you can observe this yearly pattern by plotting the mean daily temperature against time). To do this, note that any periodic function, f(t), of period T, can be written as:
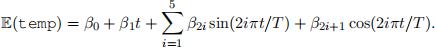
Hence a reasonable model for the Cairo data might be a ‘periodic + trend’ model, such as:
(a) (5 marks) Use lm to fit such a model. Do the default residual plots look reasonable?
(b) (6 marks) The justification for the given model suggests that modelselection should proceed by repeatedly removing the highest frequency sin/cos pair from the model, until you can reject the null hypothesis that the resulting simplified model is correct. Proceeding in this way, select an appropriate model for the data. Do not forget to re-check the residuals of your selected model.
(c) (5 marks) Does your selected model suggest that there is evidence for a change in the overall mean temperature over the years (over and above simple annual variability)? Justify.
(d) (6 marks) Now make two plots: (i) a plot of the residuals against time, and (ii) a plot of each residual against the residual preceding it. What do the two plots suggest?
(e) (6 marks) Fit a simple linear model of the form:

where the ei are i.i.d. N(0, ) r.v.s. What evidence do the results of this model offer?
(f) (5 marks) On the basis of the answers to points (d) and (e), is the model adequate for testing hypotheses about the long term change in temperature?
2024-03-20