ECON3013: Applied Econometrics (Semester 2, 2023/2024) –– Assignment 1
Hello, dear friend, you can consult us at any time if you have any questions, add WeChat: daixieit
ECON3013: Applied Econometrics (Semester 2, 2023/2024) -- Assignment 1
Submitted to the TA or teacher in hard copy before 5:00pm, Friday, 22 March 2024
Using AI tools in doing this Assignment is strongly prohibited!!!
This assignment paper has a total of 100 marks, and contributes 25% to the course’s overall assessment.
CLEARLY write down your answers/solutions to each question with your Name and Student Number on some clean paper.
Necessary steps/formulas/calculations/arguments MUST be included in your answers as a good practice.
Keep FOUR (4) decimals for all calculations/results for relatively higher accuracy, unless clearly unnecessary.
For Q8 and Q9, do and ONLY do the REQUIRED part based on your Student Number’s being even or odd.
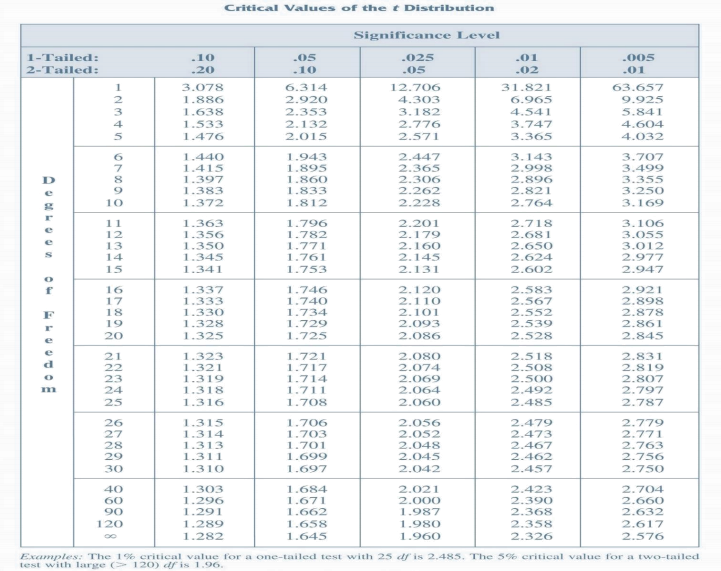
The t-table as appeared in the lecture notes IS included at the end of this assignment paper for your easy use.
|
Economy |
CO2 per capita |
Urbanization |
|
Afghanistan |
0.277459 |
25.56191 |
|
Armenia |
2.279488 |
63.9 |
|
Australia |
14.77265 |
87.31742 |
|
Azerbaijan |
3.430466 |
54.9 |
|
Bangladesh |
0.508222 |
38.177 |
|
Bhutan |
1.382237 |
42.316 |
|
Brunei Darussalam |
21.70213 |
78.25 |
|
Cambodia |
1.153169 |
24.232 |
|
China, People's Republic of |
7.750536 |
63.89027 |
|
Fiji |
1.153466 |
57.247 |
|
Georgia |
2.75471 |
59.23241 |
|
India |
1.62184 |
34.3 |
|
Indonesia |
2.08434 |
56.641 |
|
Japan |
8.058622 |
91.782 |
|
Kazakhstan |
11.29504 |
58.84898 |
|
Kiribati |
0.476398 |
55.6 |
|
Korea, Republic of |
10.99003 |
81.414 |
|
Kyrgyz Republic |
1.3919 |
34.2 |
|
Lao People's Democratic Republic |
2.652316 |
36.29 |
|
Malaysia |
7.55437 |
75.1 |
|
Maldives |
2.608418 |
40.669 |
|
Marshall Islands |
2 |
77.794 |
|
Mongolia |
6.230794 |
69 |
|
Myanmar |
0.617924 |
31.141 |
|
Nauru |
3.541488 |
100 |
|
Nepal |
0.508668 |
62.36 |
|
New Zealand |
6.160799 |
84 |
|
Pakistan |
0.835353 |
36.75427 |
|
Palau |
8.988636 |
78.9 |
|
Papua New Guinea |
0.572634 |
13.345 |
|
Philippines |
1.22411 |
47.408 |
|
Samoa |
1.022657 |
18.75403 |
|
Singapore |
7.686684 |
100 |
|
Solomon Islands |
0.321471 |
24.67 |
|
Sri Lanka |
0.996683 |
18.713 |
|
Tajikistan |
0.991487 |
26.3 |
|
Thailand |
3.819351 |
54.78681 |
|
Timor -Leste |
0.338354 |
31.3 |
|
Tonga |
1.177782 |
21.5186 |
|
Tuvalu |
0.624785 |
64.014 |
|
Uzbekistan |
3.376304 |
50.56481 |
|
Vanuatu |
0.404333 |
25.16202 |
|
Viet Nam |
3.641251 |
36.82282 |
|
Source: Asian Development Bank |
|
|
The table above contains information of 43 Asian economies on their year 2020 CO2 emissions (‘000 metric tonnes per capita) and degree of urbanization, measured by urban population as a percentage of total population. The following sample sums have been calculated from the sample for convenience, with y being CO2 emissions,x being urbanization and i the country index:
∑i(4)![]() 1 xi = 2233.17735, ∑i(4)
1 xi = 2233.17735, ∑i(4)![]() 1 yi = 160.97935, ∑i(4)
1 yi = 160.97935, ∑i(4)![]() 1 xi(2) = 139792.3132, ∑i(4)
1 xi(2) = 139792.3132, ∑i(4)![]() 1 yi(2) = 1452.88189,
1 yi(2) = 1452.88189,
∑i(4)![]() 1 xiyi = 11230.30771.
1 xiyi = 11230.30771.
Part A. Basic Statistical Assessment (30 marks)
Q1 (3 marks): Is this a cross-sectional data set, a time series data set or a panel data set? What is the reason for considering CO2 emissions on a per capita basis instead of the absolute levels (‘000 metric tonnes)?
![]()
![]() Q2 (10 marks): Find the sample means or averages (x andy), the sample standard deviations (sx and sy) of the two (random) variables x andy. Find also the sample covariance sxy and the sample correlation coefficient rxy between the two variables.
Q2 (10 marks): Find the sample means or averages (x andy), the sample standard deviations (sx and sy) of the two (random) variables x andy. Find also the sample covariance sxy and the sample correlation coefficient rxy between the two variables.
Q3 (17 marks): The Chief Economist of the World Bank claims that the average CO2 emissions per capita in Asia should be 7.00 (‘000 metric tonnes per head), about the same level in the EU counterparts. The intuition is that while the Asian economies tend to be less economically developed, have fewer industrial activities and hence less emission comparatively, their bioenergy adoption is also lower which inhibits CO2 reduction. To verify his claim, you decided to perform a test on this hypothesis using the conventional 5% significance level. Write down the detailed test procedures including the type of test, the null and alternative hypothesis, the relevant test statistics and other information needed to run the test. What is your conclusion? Will your conclusion differ if a more demanding 1% significance level is used instead? Show your work carefully and clearly. Based on your findings, do you think equal contribution by all countries in emission reduction as advocated by Western countries a fair and appropriate policy? Briefly explain.
Part B. Test Relationships (70 marks)
This Part relates to a simple linear regression model estimated using the above sample data (with the results in Part A)
and the ordinary least squares (OLS) method: yi =β(̂)0 +β(̂)1 xi + ûi =̂(y)i + ûi, wherê(y)i =β(̂)0 +β(̂)1 xi is the model-fitted or
forecast values of yi with respect to xi and ûi is the corresponding residual for economy i (i = 1, 2, … , 43).
Q4 (12 marks): Find the sample-estimated values ofβ(̂)1 andβ(̂)0 , and explain their (practical) meanings. Do they make
sense to you?
Q5 (18 marks): Find the coefficient of determination (R2) and the standard error of regression (̂(σ)). and briefly explain their (practical) meanings. Do you think they are small (low) or large (high)? [Hint: make your judgment by referencing to some benchmark to get a meaningful picture of their magnitudes.]
Q6 (12 marks): Find the standard error ofβ(̂)1 and briefly explain its (practical) meaning. Is this standard error small or large? What is the standard error ofβ(̂)0 ?
Q7 (3 marks): In terms of model fitness, do you think we can get better results by regressing urbanization (x) on CO2 emissions (y) instead?i.e. using urbanization as dependent variable and CO2 emissions as independent variable.
If the last digit of your Student Number is even, do the following Q8-even and Q9-even. If it is is odd, do the following Q8-odd and Q9-odd.
Q8-even (5 marks): For Indonesia, find the model-fitted CO2 emissions and briefly comment on the actual emissions as compare to this.
Q8-odd (5 marks): For New Zealand, find the model-fitted CO2 emissions and briefly comment on the actual emissions as compare to this.
Q9-even (20 marks): Suppose an alternative simple linear regression exercise is performed with CO2 emissions replaced
by de-meaned CO2 emissions with everything else remain the same,i.e. yi(*) = a0 + a1xi+ εi and yi(*) = yi — ![]() . Using
. Using
the properties of the summation operator ∑, show that  = 0. Find the estimated values of
  and
and  . Are they different
from  and
and  you estimated before. What can you say about the correlation between yi(*) and xi , and the R2 of this new
model? Show your step clearly and show the calculated values wherever possible.
Q9-odd (20 marks): Suppose an alternative simple linear regression exercise is performed with urbanization replaced
by de-meaned urbanization with everything else remain the same,i.e. yi = a0 + a1xi(*) + εi and xi(*) = xi — ![]() . Using the
. Using the
properties of the summation operator ∑, show that  = 0. Find the estimated values of and . Are they different
from and you estimated before. What can you say about the correlation between xi(*) and yi , and the R2 of this new
model? Show your step clearly and show the calculated values wherever possible.
2024-03-20