Econ 30041: Topics in Inequality and Poverty
Hello, dear friend, you can consult us at any time if you have any questions, add WeChat: daixieit
Econ 30041: Topics in Inequality and Poverty
Mid-term Exam
SECTION A (50 marks): Answer all questions.
1. Suppose the poverty line is calculated using the ‘Cost of Basic Needs’ approach. Calculate the monthly poverty line for each year based on the following data from rural Bangladesh:
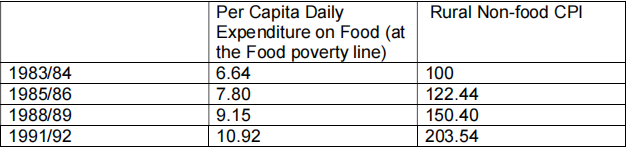
Assume that only for 1983/84 non-food basic needs expenditure is 35% of the food basic expenditure and a month consists of 30 days.
[12.5 marks]
2. Consider the following distribution of income:
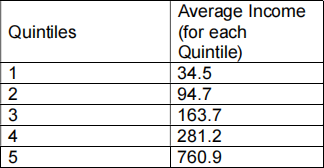
Suppose the income is distributed equally within each quintile. Then:
(a) Plot the Lorenz curve of the above income distribution.
(b) Calculate the Mean Log Deviation of the above income distribution.
[12.5 marks]
3. Consider a society S with 10 individuals. Three of them work in the modern sector of S and earn £2000 per month. The rest live in the traditional sector and earn only £1000 per month. One day, two new modern sector jobs open up and 2 individuals from the traditional move to the modern sector
(a) Plot the Lorenz curve of the before and after the two modern sector jobs open up. Using the Lorenz curve discuss what happens to the level of inequality.
(b) Calculate the Gini coefficient of the two distributions. Which distribution has higher inequality?. Discuss your findings.
[12.5 marks]
4. Suppose there are three individuals with three wealth levels in the economy. Denote the wealth levels by WA, WB and WC and suppose that WA<WB<WC
(a) Suppose that the person with wealth level A earns an annual income of YA, and consumes a fraction αA of it. If the rate of interest on asset holding is r, write down the formula for this persons wealth next year
(b) Show that if income earnings of each individual is proportional to wealth, and the consumption rate is same across all three individuals, then inequality of wealth next year must be the same as inequality of wealth this year, as measured by the Lorenz curve.
[12.5 marks]
SECTION B (50 marks): Answer 1 question. The maximum word count is 500 words (not including graphs). Please provide the word count at the end of your answer.
1. Grundler and Scheuermeyer (Journal of Macroeconomics, 2018, p.301) in Table 2 show that the impact of inequality on growth decreases as we control for more variables. In fact, under specification (4) (final column) of the same Table, inequality has no impact on growth. Is this evidence that inequality has negligible impact on economic growth? Explain.
[50 marks]
2. Conflict is often associated with grievance. How is grievance captured in the Collier and Hoeffler (Table 4, Oxford Economic Papers, 2004) and Mansoob and Gates (Table 7, Review of Development Economics, 2005)? Does the difference in the way ‘grievance’ is captured explain the contrasting conclusions the papers arrive at on the impact of grievance on conflict? Discuss.
[50 marks]
2021-11-04