STAT7055 Introductory Statistics for Business and Finance
Hello, dear friend, you can consult us at any time if you have any questions, add WeChat: daixieit
Research School of Finance, Actuarial Studies and Statistics
PAST FINAL EXAMINATION 1
STAT7055 Introductory Statistics for Business and Finance
Question 1 [19 marks]
(a) [4 marks] A student answers a multiple-choice examination question that offers four possible answers. Suppose that the probability that he knows the answer to the question is 0.8 and the probability that he guesses is 0.2. Assume that if the student guesses, the probability of selecting the correct answer is 0.25. If the student correctly answers a question, find the probability that he really knew the correct answer.
(b) [5 marks] Suppose the student takes an examination with 3 multiple choice ques-tions. Let X denote the number of questions he gets correct. Assuming that the student answers each question independently, determine the probability distribution of X and calculate the expected value of X.
(c) [10 marks] Suppose the student takes an examination with 2 multiple choice ques-tions. But this time, he gains confidence every time he knows the answer to a ques-tion. Specifically, if he knows the answer to the current question, then for the next question the probability that he knows the answer becomes 0.9 and the probability that he guesses becomes 0.1. If he does not know the answer to the current ques-tion, then for the next question the probability that he knows the answer and the probability that he guesses remain 0.8 and 0.2, respectively. Again letting X denote the number of questions he gets correct, determine the probability distribution of X and calculate the expected value of X. We can assume the probabilities of knowing the answer and guessing for the first question are 0.8 and 0.2, respectively.
Question 2 [17 marks]
Suppose that X is a continuous random variable with the following probability density function:
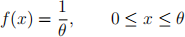
Jimmy considers himself a budding statistician and he wants to investigate the true value of θ.
(a) [2 marks] Jimmy thinks that the true value is actually θ = 2. Assuming Jimmy is right, find each of the following probabilities:

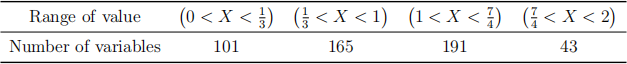
(b) [4 marks] In order to test whether θ = 2, Jimmy collects a sample of 500 of these X variables and records their values. He then tabulates how many variables fell into each range of part (a), and his results are summarised below. Based on this data, test whether θ = 2. Clearly state your hypotheses and use a significance level of α = 5%.
(c) [4 marks] Jimmy now wants to actually estimate θ. From the sample he collected in part (b), he can calculate the sample mean,
Is
an unbiased estimator of θ? Why or why not? If not, derive an unbiased estimator of θ.
(d) [3 marks] Jimmy decides it might be a better idea to use an interval estimator rather than a point estimator. Based on the sample mean of
= 0.9418 and the population variance of
= 0.3008, calculate a 95% confidence interval for µ = E(X). Interpret this confidence interval.
(e) [2 marks] Without actually performing the test, if you were to test H0 : µ = 1 against the two-tailed alternative at a significance level of α = 5%, would you reject H0? Why or why not?
(f) [2 marks] Jimmy actually wanted an interval estimator for θ, not µ. Suggest a way to convert the confidence interval for µ you constructed in part (d) to a confidence interval for θ.
Question 3 [17 marks]
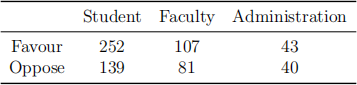
A survey was conducted to determine student, faculty, and administration attitudes on a new university parking policy. The distribution of those favouring or opposing the policy was as shown in the table below:
(a) [4 marks] The parking office claims that the population proportion of people at the university who are both students and in favour of the new parking policy is greater than 34%. Test this claim at a significance level of α = 5%, clearly stating your hypotheses.
For parts (b) and (c), assume that the students, faculty and administration were sampled independently.
(b) [4 marks] The parking office also claims that the population proportion who favour the new parking policy is that same for both students and faculty. Test this claim at a significance level of α = 5%, clearly stating your hypotheses.
(c) [4 marks] The parking office also claims that the population proportion of students who favour the new policy minus the population proportion of administration who favour the new policy is equal to 0.1. Test this claim at a significance level of α = 5%, clearly stating your hypotheses.
(d) [5 marks] The parking office now decides that it is too risky to make claims about population proportions. Instead, they now only claim that the attitudes regarding the new parking policy are independent of student, faculty or administration status. Test this claim at a significance level of α = 5%, clearly stating your hypotheses.
Question 4 [9 marks]
Suppose the manager of a manufacturing plant suspects that the output of a production line (in number of units produced per shift) depends on two factors:
● Which of two supervisors is in charge of the line.
● Which of three shifts (day, swing, or night) is being measured.
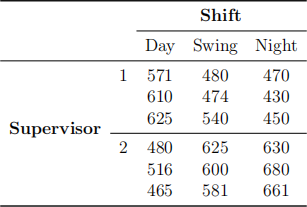
Suppose that the two supervisors were each observed on three randomly selected days for each of the three different shifts. The production outputs were recorded and summarised below:
(a) [5 marks] Suppose the sample variances of production output for the two super-visors are
= 5155.25 and
= 6096.5. Test whether the mean production output is the same for the two supervisors. Clearly state your hypotheses and use a signifi-cance level of α = 5%. Assume that the population variances of production output for the two supervisors are equal.
A two-way ANOVA has been conducted on this data and the results are summarised in the table below:
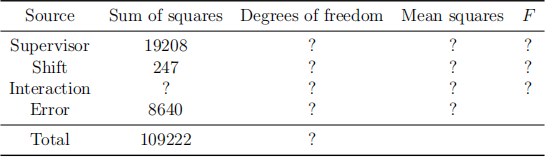
(b) [4 marks] Test whether there is an interaction between supervisor and shift. Clearly state your hypotheses and use a significance level of α = 5%.
Question 5 [41 marks]
It is generally thought that the weight of a turkey depends on its age. The following data was collected on 13 turkeys that were raised on Australian farms:
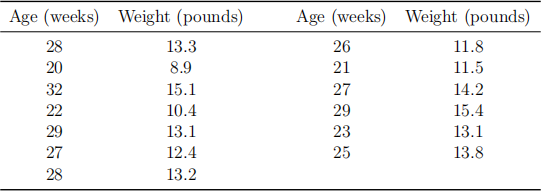
Let Y denote Weight and X denote Age. The following summary statistics are provided:
= 5.2404,
= 12.5769 and
= 3.2847.
(a) [5 marks] Fit the regression model
That is, calculate the estimates
and
.
(b) [3 marks] We have been told that the sum of squares for regression is SSR = 26.202. Calculate the standard error of estimate,

(c) [4 marks] Test whether there is a linear relationship between Weight and Age. Clearly state your hypotheses and use a significance level of α = 5%.
(d) [5 marks] Calculate a 95% confidence interval for the expected weight of a turkey that is 22 weeks old. Would this be wider or narrower than a prediction interval for the weight of a turkey that is 22 weeks old? Why or why not?
It turns out that the 13 turkeys were not all raised on the same farm. A regression model with Weight as the dependent variable and Age, NSW and VIC as independent variables was fitted to the data, where NSW is an indicator variable that equals 1 if the turkey was raised in New South Wales and VIC is an indicator variable that equals 1 if the turkey was raised in Victoria. Some regression output is displayed below:
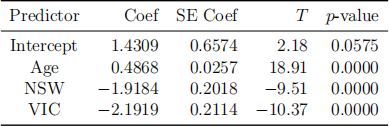
(e) [1 mark] Write down the general form of the model.
(f) [3 marks] Test the overall significance of the model. Clearly state your hypotheses and use a significance level of α = 5%.
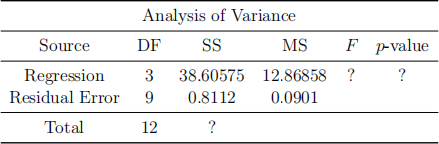
(g) [3 marks] Calculate the coefficient of determination,
, and interpret the value.
(h) [4 marks] What is one of the drawbacks of using
(i) [3 marks] What do you conclude about the relationship between Weight and Age? Clearly state your hypotheses and use a significance level of α = 5%. Interpret the coefficient parameter for Age.
(j) [2 marks] Test whether a different intercept is needed for turkeys from NSW. Clearly state your hypotheses and use a significance level of α = 5%.
(k) [2 marks] Test whether a different intercept is needed for turkeys from VIC. Clearly state your hypotheses and use a significance level of α = 5%.
(l) [5 marks] Suppose we want to test whether a different coefficient parameter for Age is needed for turkeys from NSW and whether a different coefficient parameter for Age is needed for turkeys from VIC. What additional variables do you need in order to test these claims? State clearly the general form of the model that you would fit and the hypothesis tests you would conduct.
(m) [1 mark] Based on your model from part (l), write down the form of the model for turkeys from NSW.
2021-11-04