MGMT3004 Assignment 2 Defining a complex problem and developing a dynamic hypothesis
Hello, dear friend, you can consult us at any time if you have any questions, add WeChat: daixieit
MGMT3004 Assignment 2
Defining a complex problem and developing a dynamic hypothesis
Due Date: Submit via Moodle by March 14 (4 pm AEST*)
Weighting: 35%
Length: 8-page written report (maximum)
X, previously known as Twitter, operates as an internet-based social network platform characterised by micro-blogging, real-time interactions and content updates through a newsfeed. Established in 2006 as Twitter, the company gained fame for its iconic little blue bird logo. The platform popularized the term 'tweeting,' embodying its unique contribution to contemporary culture. In 2021, there were 362 million users worldwide, with the US being the biggest market.
The company has grown considerably since its founding in terms of users (Fig.1) and revenues
(Fig. 2). Most of the company’s revenues come from advertising (Fig.3), with a small portion being generated through data licensing. However, net profits have not followed a similar pattern. Twitter booked losses (i.e. negative net profits) from 2010 to 2017, managed to achieve positive net profits in 2018 and 2019 and then returned to losses in 2020 and 2021.
Despite its popularity and recognition, the micro-blogging platform's user base is significantly smaller than other social media giants like Facebook, YouTube, WhatsApp, TikTok and Instagram, each with over 1.5 billion monthly active users. In 2021, Twitter generated an annual revenue exceeding USD $5 billion, while experiencing a net loss of $221 million. The last quarterly income reported by Twitter was in the second quarter of 2022, indicating a loss of USD $270 million.
Against this background and unstable lookout, in April 2022, the bombastic businessman Elon Musk unveiled his intention to purchase the publicly listed company, finalising the deal in October 2022 for USD $44 billion. Under the new ownership, the company has experienced numerous transformations and has ceased to be publicly traded. To cut costs at Twitter, one of Musk's first managerial decisions was to reduce the staff by 80% (Fig. 4). Then, in April 2023, Twitter became X Corp., after Musk decided to merge Twitter with X Holdings, in an attempt to rebrand the social network to X.
Another radical change implemented by Musk, in an attempt to increase revenues, was the adoption of a paid subscription for premium accounts (the so-called ‘blue tick’), through which subscribers could access additional benefits, such as experiencing ad-free surfing and proving to their network that their account was genuine and connected to a real and identified individual. However, this change sparked much discussion, which led the company to modify the policy as some discontent was registered among the users and because of some unexpected side effects (e.g., some weird profiles gained the blue tick or names were stolen).
Despite all of these changes, some surveys show that many loyal users are not critical of or worried about recent changes. In March 2023, 40 percent of current X users stated they were highly likely to continue using the platform in the coming year.
Elon Musk's managerial decisions and his personality have generated a lot of public attention and visibility for X/Twitter, with the company frequently on the front page of the news. For example, he is the most followed person on X/Twitter as of August 2023, with more than 140 million followers and ahead of pop stars, athletes and even US presidents. However, the attention has often been due to Musk’s controversial actions, which have led several companies to stop advertising their products on the platform.
The future of X/Twitter remains nebulous, with many questions to answer: can it stay relevant? Is decline unavoidable for the company? Are Musk’s actions having an overall positive or negative effect on the company's future? The company financials and most other quantitative data have not been available since Twitter's last quarterly report was released in early 2022, though there are estimates available from analysts that cover the sector. The most optimistic estimates show a slowdown in the number of users, while other estimates show a reduction in users (Fig. 1). The company has lost a great deal of its value since Musk purchased the company – with some estimating 90% of the company’s value has been destroyed – and external estimates indicate a reduction of at least 15% in users and a 54% decline in ad revenues for the last year.
Overall, X/Twitter, like other social media companies, experienced a first phase of significant growth, followed by a slowdown and plateau, and now faces an uncertain future after a change of ownership and a large number of changes.
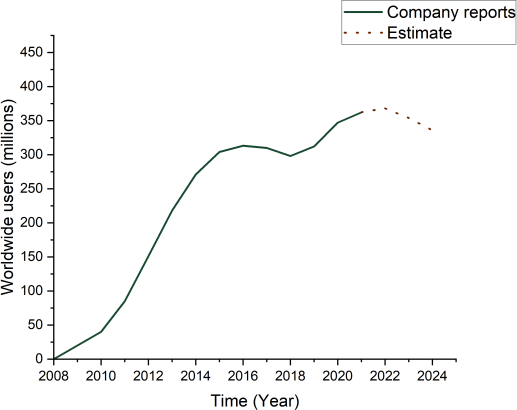
Figure 1. X/Twitter worldwide users. Data from businessofapps.com and statista.com.
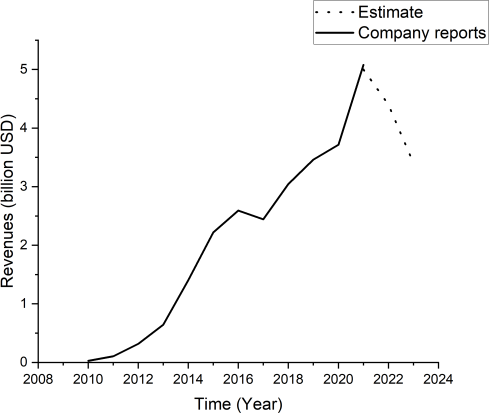
Figure 2. X/Twitter revenues. Data from businessofapps.com and statista.com
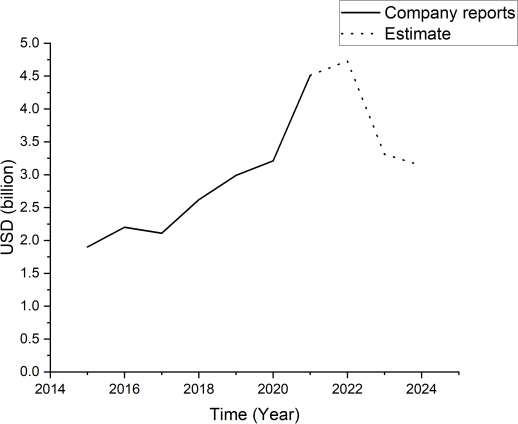
Figure 3. X/Twitter revenues from advertising. Data from businessofapps.com and statista.com
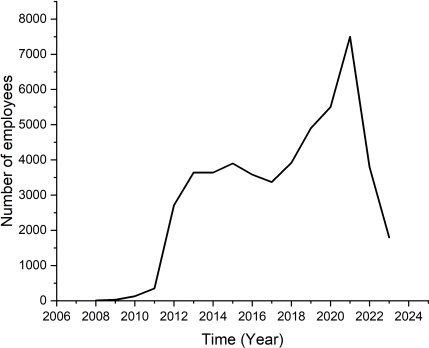
Figure 4. X/Twitter employees
I recommend reading the articles cited in the footnotes to prepare for the assignment questions below. In addition, I suggest learning more about X/Twitter from other news articles and industry reports. This information-gathering phase will help you better understand X/Twitter business and Elon Musk's mental models so that you can better answer the assignment questions below.
I. Problem articulation
1.1 (10%) Provide a list of variables you believe may be important in understanding X/Twitter’s dynamic behaviour patterns (as shown in the BOT graphs above). Be sure to capture the variables included in the assignment description above and then add to them. Listing variables is cheap and fast, so try to think broadly about the different parts of X/Twitter system.
1.2. (15%) For the first three BOT graphs provided above (Figures 1-3), extend the graphs (by hand) to show the “Hope” and “Fear” scenarios faced by X/Twitter management over the next five years (out to 2029). Next, add some additional behavioural over time (BOT) graphs – beyond the four already provided – to define and explain the dynamics that you are trying to understand further. These additional BOT graphs should show the behaviour over time of some of the variables you identified as important in 1.1. Do not shy away from “soft” variables if you believe they are important. Wherever possible, include the actual historical time series data up to 2024 (or as recent as possible) and then extend the graphs out to 2029 by hand drawing in the “Hope” and “Fear” scenarios (or choose more appropriate labels if needed for the variables you select). But do not worry if you cannot find actual historical data for the variables you want to include. In this case, just draw the patterns of behaviour you think are roughly correct for these variables. If done well, two or three additional BOT graphs will be sufficient for an outstanding mark. Be sure to also provide a short written explanation (1-2 sentences) of each BOT graph. Longer descriptions will not be correlated with higher grades.
II. Developing a dynamic hypothesis
2.1. (20%) Draw a high-level (simplified) causal loop diagram, using a subset of the variables you listed in your answer to Question 1.1, to explain the intial growth of X/Twitter from 2008 to 2014. Your diagram should show the key feedback loops that could explain this initial growth of the business. Diagrams with multiple, interacting feedback loops generally capture a higher quality dynamic hypothesis – provided the causal pathways are logical and clear. An outstanding answer to this question will include five or more feedback loops that play an important role in driving the dynamics over time. Your diagram should be a maximum of one page.
Along with the diagram, briefly describe in a few sentences how each feedback loop helps create the dynamic behaviour shown in the BOT graphs Figures 1 – 4 and that you included in your answer to Question 1.2. It is not sufficient to just describe the graphs. Explain the causal connections in each feedback loop but do not be wordy in your descriptions. Longer descriptions will not be correlated with higher grades.
Be sure to identify the polarity of each causal link (‘+’ or ‘-’), the polarity of each feedback loop (B for Balancing or R for Reinforcing), and provide a short descriptive name for each loop. While your diagrams should be presented clearly and legibly, it is not necessary to produce professional quality graphics. You can draw the loops neatly by hand or use any software package that enables you to draw curved causal links (e.g., Vensim). Content is more important than presentation in grading.
2.2. (20%) Identify some of the important feedback loops that explain why X/Twitter’s initial growth slowed down after 2014 (and through about 2018). Draw these feedback loops in a high- level (simplified) stock and flow diagram and provide a brief written description of each loop. You can either draw this as a separate diagram from the one you drew for Question 2.1 (although you may want to include some common structure), or add these loops to the previous diagram if that is easier. Also, be sure to include causal link polarities, loop polarities, and a short descriptive name for each loop. Once again, while your diagrams should be presented clearly and legibly, it is not necessary to produce professional quality graphics.
2.3. (20%) Use the diagrams you drew for Questions 2.1 and 2.2 to think through the effects of Musk’s actions on X/Twitter since 2022. In the medium- or long-term, will those actions help X/Twitter to remain relevant and increase profits or will they harm the company? It is important you use the diagram(s) you developed to analyse and describe what you think are the effects and consequences of Musk’s actions on the system (e.g., what loops do these actions trigger or strengthen?). If it helps or you find it necessary to articulate your ideas, you can draw additional causal structure and/or feedback loops to describe Musk’s effect on the system, but it is not necessary to draw additional feedback loops if you believe the effects of Musk’s decisions/actions will operate primarily through the existing loops you already have drawn.
III. Model formulation
3.1. (15%) From the diagram you developed, identify three stocks and the associated flows for each stock. Sketch these three separate stock and flow diagrams in a figure and indicate the units of measurement for all stocks and flows. Do not include any auxiliary variables in your diagrams.
2024-03-17