AUENV 218: Lab 4 Topological repairs and Queries 2024
Hello, dear friend, you can consult us at any time if you have any questions, add WeChat: daixieit
AUENV 218: Lab 4
Topological repairs and Queries
March 4, 2024
DUE DATE: March 11, 2024, Submit with Lab 3 as Lab Report #2 on eClass
Learning Goals: To clean previously digitized files and remove errors in those files, digitize lines with fewer errors using Editor tools, and import X, Y coordinates from an Excel file (created from output from a GPS into a shapefile).
1. Today’s data are in the folder labeled “Lab 4” on our shared Google Drive folder. Please download the data from this folder to your pre-created Lab folder for this course (hopefully by now you have a dedicated folder for the course and its labs). Once you have the Lab 4 folder copied to your own Google Drive, FOR THE LAB, copy it to the Temporary folder for ArcMap as you have done in previous labs.
2. To answer the questions for this lab, open a new Word/Google Doc file and save it under the heading: YourLastName _Lab 3. Remember to save often. This lab is due on March 11th with the answers from Lab 4. Please, do not submit your lab report as a pdf – it takes me twice as long to mark it.
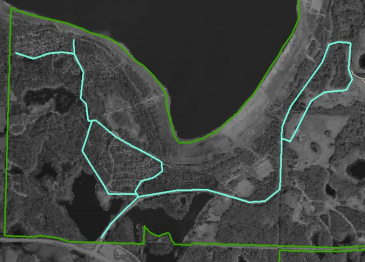
3. Open ArcMap and create a New Empty Map. Do not designate a default geodatabase – just select Cancel when the Getting Started window appears. Set your map Environment to your Lab4 folder (Geoprocessing > Environment > Workspace). Add the following files to your map: Miquelon.jpg, lab-trails.shp and Miquelon.shp. You will need to be able to see through the data (i.e., polygons) and see the line features on the aerial photograph (a black and white image). To do that, make the Miquelon.shp layer medium green with no fill (outline width 3.00), the lab-trails.shp a yellow coloured line (line width 2.00). Your screen should look similar to the one below (Note: we are using an aerial image that I have cropped from a much larger image and georeferenced).

4. Zoom into the area of trails east of the lake. Notice that the trails do not link together as they should for a continuous trail network. The digitized trail layer includes some errors that make the data inaccurate. Today you will learn some tricks to correct such errors. Make sure you set your map and display units to meters (Hint: View>Data Frame Properties>General>Units)
Question 1: We discussed several digitizing errors in class. What kinds of digitizing errors can you identify in the trail data provided? (2 marks)
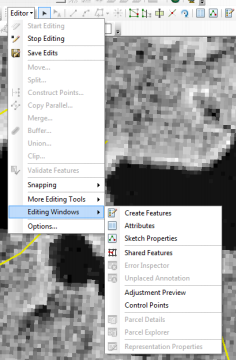
5. Now we will correct those poorly digitized line features in the view above. Start Editing under the Editor toolbar (add the editor toolbar if you haven’t already). (A short note: If your Create Features editor does not appear, start an editing session and then go to Editing Windows and select Create Features. The window should then appear.) Select lab_trails.shp as the target file.
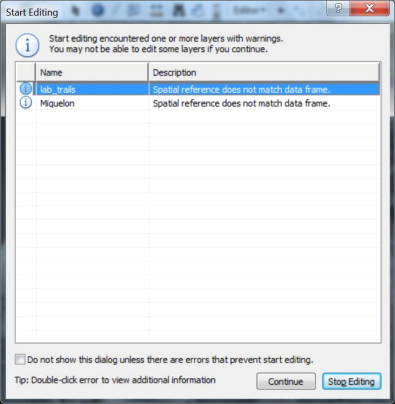
You might also see this window. If so, just select Continue.
6. Under the Editor toolbar, select Snapping Options, and choose a tolerance of 10 pixels. Snapping connects drawn features together, based on topological rules that you select. It helps in editing because it ensures that edited lines match to other lines or polygon edges correctly and thereby create meaningful topology. You should edit your snapping options any time you are creating a new feature (specifically shapefiles) in ArcGIS.

Question 2: What are vertices, edges, and ends? How do they relate to meaningful topology in GIS? (3 marks)
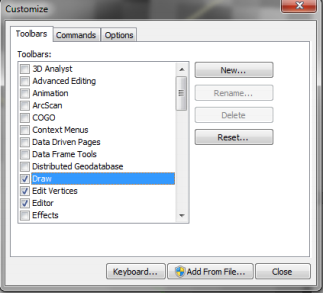
7. Digitizing errors create errors in topology. To clean these errors, we will use a combination of the Topology toolbar and the Editor toolbar. Add the Topology toolbar (Customize>Toolbars>Topology).

Question 3: What does snapping do (this is a “how” question)? (1 mark)
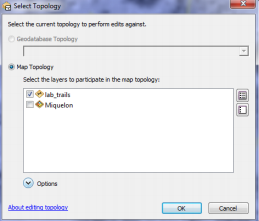
8. Click on the Select Topology icon on the Topology toolbar. The Select Topology window will appear.  . Make sure you only select lab-trails as the layer.
Explore the About editing topology hyperlink at the bottom to see more about this topic. Also click on options to see what the Cluster Tolerance is. Look up Cluster Tolerance on the ArcGIS help menu to learn more. You will want to fix all of the digitizing errors you see with the trail layer. In some versions, there is a dropdown menu beside the Topology icon. Click it to see the tools available to you if these options exist in your version. Otherwise, they will be displayed on the toolbar.
Question 4: In your own words, what is the difference map topology and geodatabase topology? (2 marks)
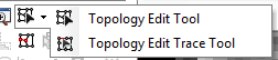
 OR
OR
Find the Topology Edit tool – you will need this tool throughout this part of the lab.
9. Zoom into the lab_trails.shp file and find a section that requires topological repair. Use the Edit tool from the Editor toolbar the select the section of the trail you will repair. Once the section is selected, it will turn blue
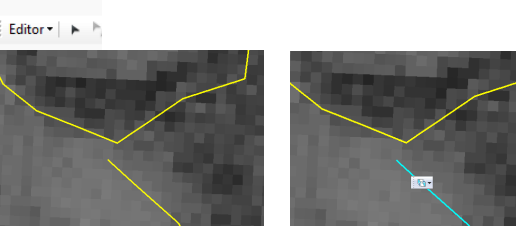
10. Once the segment is selected, choose: “Edit Vertices” – a small toolbar should appear either in the Data View or on the toolbar.

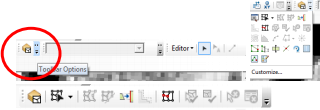
If it does not appear, you can select it through the Customize menu (click the Toolbar options dropdown menu at the end of the Editor toolbar. You can then select the Edit Vertices box. The Modify Sketch Vertices tool on the far left of the toolbar will be important.
11. You might need to delete a vertex, add a vertex or finish a sketch. It is often very helpful to create a vertex at the location on the adjacent line where you would like your end vertex (end node) to join with it. Double-clicking will be required with some versions of ArcMap. The key is to not move the line if you can avoid it. If you do, just go to Edit>Undo Move. If you add a vertex and want to remove it you can use the Edit menu to remove the vertex. With the Modify Vertex tool you can extend the last vertex to the adjacent line. To create topology, you will now need to use the Topology Edit tool on the Topology toolbar.  Use this tool to make a square around the new intersection you’ve created by joining the two trails (hold down the left mouse and “draw a small box around the intersection. Do not save edits until you have fixed all the issues. In some cases you will need to extend a line, in others you will have to remove part of a line. In all cases, once you have correctly joined the trail segments use the Edit tool to create topology between the two trail segments (the trails will turn pink when this tool is used). Once all the issues are corrected, you can then Save Edits and Stop Editing. Now zoom into the problem junctions and see if the lines are correctly joined.
12. Now that we have learned how to correct errors in digitized layers, we will learn how to digitize in a way that will minimize the creation of errors in the first place. Create a new line shapefile in ArcCatalog called good_roads.shp. Remember to project the file in the same coordinate system as the others in your map (Hint: You can import the properties of one of the vector layers already loaded into your map or manually navigate to the desired coordinate system). Select “polyline” as the feature type. Once created, add it to your ArcMap document.
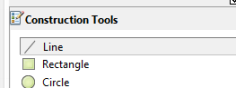
13. Add your newly created file to the Miquelon map and start Editor. If the file doesn’t appear in your Table of Contents window, in the Create Features window, select the Organize Templates icon  , highlight good_roads.shp. and then New Template. The new shapefile should now appear in your Create Features pane. When you click on good_roads, you will see that Line is one of the options in the Construction Tools window.
14. In the Editor toolbar, scroll down to Snapping> Snapping Toolbar. Once open, place the Snapping Toolbar in the toolbar area above your map window. Make sure “good_roads.shp” is selected and then ensure that “end snapping”, vertex snapping”, and “edge snapping” boxes are selected (the boxes adjacent to the word “Snapping”. No other feature/layer should be selected. Do not select the “point snapping” box. Ensure that “Use Snapping” is selected.
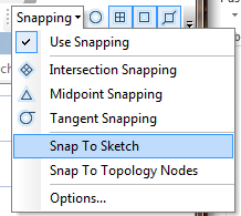
Also select all the features of Snap To Sketch and Snap To Topology Nodes. In addition to assisting in editing digitizing errors, snapping aids in initial digitizing because it ensures that a newly digitized feature matches perfectly with other features in the layer, or “snaps” to each of these topological elements. Once you have selected the various options, close the Snapping dropdown menu so you can see the entire map screen. You can also open the Snapping Options on the Editor dropdown menu and set your tolerance distance as mentioned above(see help menu to read about tolerance distance).
15. Now select Create Features (Editor>Editing Window>Create Features) and click on the good_roads.shp and then Line tool under the Construction Tools.
16. On the image, find the main road entering Miquelon Provincial Park and begin to sketch the road by digitizing (clicking on spots along the road to create a line that follows the road as seen in the underlying aerial photograph). Complete the roads shown in light blue in the screen shot below. Try to double-click in the middle of the line to which you are joining your new feature so a node is formed at that junction.
17. Once you have completed all the roads as shown above, make sure that your topology is clean. Save Edits under the Editor toolbar. Then select Stop Editing.
Question 5: What happens if you sketch too far over an intersecting road line? How would this result change if edges were selected as snapping topology controls? (1 mark)
18. As an alternative to digitizing features, you can also add X,Y points collected from another source (e.g., a GPS unit) as a digital database file. We will add a series of points collected by GPS that represent a subsample of beaver lodges at Miquelon. The file we will use is downloaded from a Garmin 60CX GPS unit. The text file that has been downloaded from the GPS has been modified for you to create the MiquelonBeaverLodges.xls file found in the Lab 4 folder. These data are UTM coordinates and have column headings for Easting and Northings, which are specific to UTM Zone 12U.
ArcGIS allows you to .add an Excel file directly into your .mxd document. Add the BeaverLodges.xlsx. to your document (some earlier versions of ArcMap only accept .xls formats, so you would need to save the file in that earlier version of Excel). You will see a window like the one below (Hint: when prepping your Excel document for the GIS, try to only have one worksheet.) Make sure the first row of the worksheet is properly formatted, since it will be used for the field names in ArcGIS. You should follow these general best practices for field naming, particularly if you want to join an Excel table to another table in ArcMap:
a. Field names must start with a letter.
b. Field names must contain only letters, numbers, and underscores.
c. Field names must not exceed 64 characters.
19. In the case of this file, choose the BeaverLodges$ data. Once added, you should notice that your Table of Contents window the data layers are listed under the List by Source format rather than the List by Drawing Order option.

20. Right-click on BeaverLodges$ and choose Display XY Data. The Y Field also indicates Easting – switch this field to Northing. Next you need to identify the spatial reference of the input coordinates unless it is already set correctly.
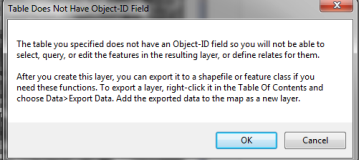
21. You will see that BeaverLodges$ Events is added to the map (although you might get a warning as seen below. Just click OK). Change the symbol to a Circle 1 that is bright in colour and 12pt in size. Zoom to layer to see the points.
Question 6: A GPS is one means of collecting XY data. Name one other means of obtaining XY data for the beaver lodge data. (1 mark)
22. Right-click on BeaverLodges$ Events in the Table of Contents and select Data>Export Data. Make sure you direct the file to your Lab 4 folder on your N: drive or thumb drive for the output location for the shapefile. Rename the shapefile before selecting Save (e.g., Beavers.shp). Agree to add the exported data as a layer in your shapefile and it will be added to your map. You have now created a permanent shapefile. Remove the layer containing BeaverLodges$ Events and then switch to the List by Drawing Layer option of the Table of Contents window. Once again, correct the symbology of the lodges as per Point 19 above.
Question 7: How many active lodges and how many inactive lodges are in the database? (1 mark)
23. Zoom to the extent of the Miquelon Park boundary. Create a final map that shows the new_roads.shp, trails.shp, the Miquelon.shp, the raster image, and the beaver lodges (symbolized by active and inactive lodges). Bring out your inner cartographer. Export it as a JPEG at 96 to 100 dpi (no larger). (Map = 4 marks)
24. Using the Select by location tool determine how many active lodges are within 100 meters of the park trails, are within 500 meters of park trails and are within 1000 meters of park trails. Provide the answer for question 8. Make sure to clear selected features before each search.
Question 8: How many active lodges are within 100 meters of the park trails, are within 500 meters of park trails and are within 1000 meters of park trails? (2 marks)
25. Now use the measure tool  to measure distances on the map. It is always important to know the map units when using this tool. Another option for measuring distances between features (in this case points) is to use the Proximity tool “Point Distance” in the Analysis Tools in ArcToolbox. For this proximity tool to work, however, you need to have two different features (it isn’t meaningful to measure values against themselves). Create a new layer for Active Lodges and another layer for Inactive Lodges.
26. Open the Point Distance window in ArcToolbox and add the active lodges layer as Input Features and inactive lodges as the Near Features. Make sure the Output Table is mapped to your drive. You can change the name if you’d like, but make sure there are no spaces and that the file name isn’t too long. Keeping the default name is fine too. Ensure that “Meters” is your distance, although we won’t be using the Radius option in this lab. Wait for the blue text to stop scrolling along the bottom of the window and a green check box to appear and disappear quickly on the lower right-hand corner of your screen. You will now be back in the List By Source window of the Table of Contents and there will be a table file added to the layers. Right-click on it to open it. To answer the questions below, remember that FIDs are used, not lodge numbers.
Question 9: How far apart are Lodge 13 and Lodge 6 as the crow flies using the measure tool? How far apart are they using proximity analysis in ArcToolbox? (2 marks)
Question 10: Which are the three sets of active lodges and inactive lodges that are closest together and, therefore, most accessible for a beaver to travel overland directly between lodges (e.g., to find new ponds)? The same active lodge can only be used once. (1 mark)
2024-03-15