ECON2206 Introductory Econometrics Problem Set 1
Hello, dear friend, you can consult us at any time if you have any questions, add WeChat: daixieit
ECON2206 Introductory Econometrics
Problem Set 1
Assignment instructions
• You must submit your work via the Turnitin link on Moodle by 16:00 on Friday March 8,2024.
• This assignment will be marked for the course assessment and will be worthI 10% of your final mark. You must attach your Stata do-file to your answers (by typing Stata codes or pasting screenshots of the do-file window or the result window in your answer) and failure to do so will result in a zero mark for the computing questions.
• Name, student number, course title, tutorial group number and tutor’s name should be clearly included in the submission. Your answers including Stata do-file should not exceed 6 pages. The Assignment is based on the material covered in both lectures and tutorials up to the end of Week 3.
• The assignment is INDIVIDUAL work. You may discuss the assignment with your peers, but you must submit YOUR OWN answers.
• If the answer requires some mathematical calculation show the steps, don’t just report the final results.
• This assignment has a total of 88 points awarded.
One core question in Labor Economics is the relationship between an individual's skills and their wage. In this exercise, we will explore this relationship using the "multidimensional.dta" dataset, which comprises data for 1,260 workers. The outcome variable, "wage," denotes the hourly wage rate ($/hour).
For this exercise, we will start with the most conventional proxy for skills: years of schooling, represented by "educ."
Additionally, the dataset encompasses various other variables that we will examine, including "noncog", which assesses noncognitive skills on a scale from 0 to 4, with 4 indicating the highest level of skill, a gender dummy variable ("female"), and location variables indicating residence in the South ("south") or a big city ("bigcity"). The dataset also contains information on the industry of employment, specifically whether an individual works in the service industry ("service"). Descriptive statistics for these variables are provided in Table 1.
Table 1: Descriptive Statistics
|
Variable |
Obs |
Mean |
Std. Dev. |
Min |
Max |
|
wage |
1,260 |
6.31 |
4.66 |
1.02 |
77.72 |
|
educ |
1,260 |
12.56 |
2.62 |
5 |
17 |
|
noncog |
1,260 |
1.52 |
1.00 |
0 |
4 |
|
female |
1,260 |
0.35 |
0.48 |
0 |
1 |
|
south |
1,260 |
0.17 |
0.38 |
0 |
1 |
|
bigcity |
1,260 |
0.22 |
0.41 |
0 |
1 |
|
service |
1,260 |
0.27 |
0.45 |
0 |
1 |
|
|
|
|
|
|
|
1. [6pts] Using the data in multidimensional.dta, run a simple linear regression of wage on educ:
wage = a0 + a1 Educ + U (1)
and estimate by OLS. Report the results in equation form, including the sample size and R2 . Assume that the Gauss-Markov assumptions 1-4 hold and interpret the estimated coefficient a1(̂) . (Please pay attention to the unit of measurement when interpreting the coefficient).
2. [6pts] Let’s consider another functional form, the log-linear model:
log(wage) = β0 + β1 Educ + U (2)
Estimate model (2) by OLS and report the results in equation form, including the
sample size and R2 . Assume that the Gauss-Markov assumptions 1-4 hold and
interpret the estimated coefficient β1(̂) . (For your convenience I already generated
log(wage) (lwage). Log here refers to the natural logarithm).
3. [8pts] In addition to the two regression models we’ve discussed, there are other possible regression models between wage and educ. For each of the following models, determine if it is a linear regression model.
log(wage) = β0 + Educβ1 + Z (a)
wage = β0 + β1 Educ + β2 Educ2 + w (b)
1/wage = β0 + β1 Educ + β2service + β3 Educ ∗ service + Q (c)
log(wage + β0) = β1 Educ + U (d)
4. [10pts] Explain the meaning of the zero-conditional-mean assumption for the simple linear regression in Model (1) (from Q1), both mathematically and in plain language (please be sure to include both the mathematical expression and a clear explanation of what the assumption represents in this example). Provide one possible reason why the zero-mean condition (ZMC) might NOT hold in Model (1). Interpret a1(̂) in model (1) if the “zero conditional mean assumption” did NOT hold.
5. [18pts] Recent literature has broadened the scope of skill measurement from a unidimensional concept to a multidimensional concept. Considering an occupation as a collection of tasks, it is logical to conceptualize skills as a portfolio possessed by an individual, with the returns on different skill dimensions varying across markets. In this exercise, we adopt a simplified approach by modeling skills in two dimensions: cognitive and noncognitive skills. The previously mentioned "educ" variable serves as a proxy of cognitive skills. To incorporate a measure of individuals' noncognitive skills, we introduce a control variable ("noncog") in Model (2), representing skills that encompass social interactions, physical tasks, strength, and eye-hand coordination etc.. For this problem, assume that the Gauss-Markov assumptions 1-5 hold for this new model.
log(wage) = Y0 + Y1 Educ + Y2 Noncog + U (3)
a. Estimate the extended model and present the results in equation form, including the sample size and R2 .
b. Interpret the two coefficients of educ and noncog, Y1(̂) and Y2(̂) respectively.
c. Compare Y1(̂) to β1(̂) obtained in question 2 (from model (2)).
d. Comparing Y1(̂) to β1(̂) in model (2), what do you conclude about the sign of the bias on β1(̂) in model (2), from not controlling for individuals ’ noncognitive skills?
e. Given the estimates from the extended model (Model (3)) and the sign of the bias on β1(̂), are educ and noncog positively or negatively correlated?
6. [10pts] Using the extended model in Q5 and assuming that the Gauss-Markov assumptions 1-5 hold, is educ statistically significant at the 1% significance level? Conduct the test manually and present your conclusion.
7. [6pts] Find and interpret the R2 of Model (2) and of the extended model in Q5. Explain why the R2 is higher for the model in Q5 than for Model (2).
8. [10pts] Based on the results in Q5, ssuppose an individual graduated from middle school (educ = 9) and has the highest possible value for noncognitive skills. What’s the predicted hourly wage for individual A? Another individual B, graduated from university (edu = 16), but has the lowest possible value for noncognitive skills. What is the hourly wage for individual B? Find and interpret the difference in predicted log wage between these two individuals.
9. [14pts] Figure 1 depicts the log(wage) distribution by industry (service vs. non-service industry).
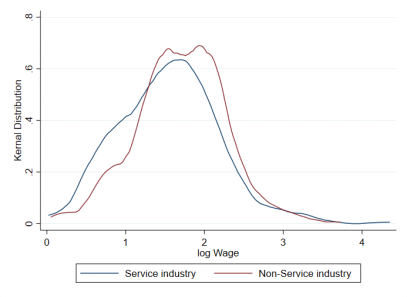
One could argue that wages depend also on the industry that an individual works in. To capture the industry difference in wages, your friend proposed the following regression.
log(wage) = β0 + β1 Educ + β2 Noncog + β3seTvice + β4 NonseTvice
+ U (4)
where seTvice and nonseTvice are dummies to indicate whether the individual works in a service or non-service industry, respectively.
a. Which Gauss-Markov assumptions are potentially violated in equation (4) by including both industry dummies?
log(wage) = β0 + β1 Educ + β2 Noncog + β3service + U (5)
and found the coefficient on service is significantly negative. Can we conclude that individuals working in service industries have lower wages because they tend to have lower education and lower noncognitive skills? Why or why not?
c. A third friend contends that Model (5) may not be valid because a worker’s industry choice is determined by their skill set, which includes both education level ('educ') and noncognitive skills ('noncog'), making 'service' correlated with these variables and potentially violating Gauss-Markov MLR assumption 3. Do you concur with this assessment? Please provide your rationale.
2024-03-09