MATH(3/6)9542 RISK THEORY 2023/2024
Hello, dear friend, you can consult us at any time if you have any questions, add WeChat: daixieit
COURSEWORK 1 FOR MATH(3/6)9542 RISK THEORY 2023/2024
READ ME: rules of the game.
• You can use any result from the lecture (notes) and exercises. Provide a reference if you do, e.g. ‘Using Theorem 1 in the notes, ...’. In particular you can also make use of the list of distributions from the notes, which is attached to this coursework for your convenience. You cannot use anything from any other resources.
• Make sure that you explain your thinking and the steps in your working in detail so that I can readily follow your solution — recall that marks are awarded for your working, not (only) for your end answer.
• For questions that involve the use of R, make sure to attach the R code you wrote and the resulting output to your solutions. It is perfectly fine to have your R code and output on separate pages from your working by hand, in that case just make sure it is clear to which question which bit of R code/output belongs.
• If you encounter any issues installing/loading the copula package in R on your own device, then first make sure that your R/RStudio installation is up to date (this resolved occasional issues in the past). If you have done that yet still encounter issues, then you can of course always use a computer in a UoM computer cluster (like the one in ATB for instance), or use an online R environment like the (free) one on https://posit.cloud/ e.g.
• If the phrasing/meaning of any of the questions is unclear to you, or if you encounter any unexpected problems (with R or otherwise), then please just get in touch and ask me!
• Finally, recall that any work you hand in must be yours and yours alone!
Good luck!! :)
1. ChatGPT (by OpenAI) is an online chatbot that uses a ’large language model’ trained on massive amounts of data to interact with in natural language. Its abilities has been causing a lot of headlines since its first release a few years ago.
Now, have a brief conversation with ChatGPT about an insurance related topic of your interest (an example could be the role of ML/AI in insurance), where ’brief’ means that three or four questions & answers is enough, and include that conversation in your solution. Also briefly (a few sentences is fine) explain why you asked the questions that you did, and briefly comment on what you think about the replies that you got.
You can find ChatGPT here: https://chat.openai.com/chat. Of course registering for a free account which gives access to ChatGPT version 3.5 is perfectly fine.
Note: due to its massive popularity you may at moments experience delays interacting with ChatGPT. For this reason please don’t leave this question until the very last moment! [4 marks]
2. An insurance company selling life insurance policies has conducted health check tests on 500 prospective policyholders who want to buy a certain life insurance product. (This is common practice for life insurance companies for certain categories of products). Such a check results in values for three important indicators. You can find the results in the file health check data.txt on the course Blackboard page, in the folder ’All things coursework’. You are curious whether this data gives reason to believe that the 500 policyholders can be split up into a number of subgroups with distinct health profiles. If this would be the case then the company could investigate offering different products with different premium and payout levels attractive to propspective policyholders with distinct health profiles.
Download the data to your device, and use Lloyd’s algorithm for K-means clustering in R to answer the above question.
Note: after downloading the file you can e.g. make the data accessible as a matrix object in R as follows:
1 data < -as. matrix ( read . table (" health _ check _ data .txt ",header =FALSE ,sep =" ") ) [6 marks]
3. Your colleague at the insurance company has recently started learning about clustering. He has just completed his first attempt to apply Lloyd’s algorithm for K-means clustering to a certain dataset and asks you to comment on his results. He shows you the following graph, which shows for K = 1, 2, . . . , 10 the optimal ’total within-cluster sum of squares’ i.e. the optimal  W(Ck) (we denoted it by J
∗
(K) in the lecture) as computed by R’s kmeans() function:
W(Ck) (we denoted it by J
∗
(K) in the lecture) as computed by R’s kmeans() function:
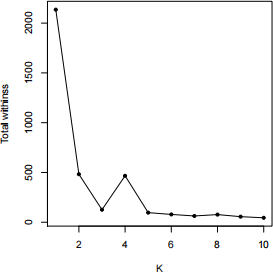
What irregularity do you observe in this graph? What change would you advise your colleague to make in his R code to try to resolve it? Briefly motivate your answer. [4 marks]
4. The Frank copula is the mapping Cθ : [0, 1]2 → [0, 1] given by the expression

where θ ∈ R \ {0} is a parameter. Consider a pair of random variables (X, Y ) with copula Cθ and a marginal Gamma(2, 2) distribution for both X and Y.
(a) Using R, produce a scatter plot of 5000 realisations of (X, Y ). Do this for four values of θ: −700, −0.01, 0.01, 700.
Note: after loading the copula package, Cθ is available via the command frankCopula(theta). [3 marks]
(b) By visually inspecting the plots you produced in part (a), what do you think the limiting copula is for θ → −∞, θ → 0 (the limits for θ ↑ 0 and θ ↓ 0 are the same) and θ → ∞. Motivate your answers briefly (but precisely)!
Hint: all the copulas apearing in these limits are well known ones that we have previously encountered in the lecture notes or on the exercise sheets. [3 marks]
2024-03-06