ECON 372: Data Analysis and Applied Econometrics in Practice
Hello, dear friend, you can consult us at any time if you have any questions, add WeChat: daixieit
ECON 372: Data Analysis and Applied Econometrics in Practice
Assignment 2
Instructions:
Upload Files:
For the assignment, submit a pdf document that combines the following:
● a PDF containing the answers to your questions, with the adequate explanations and interpretations;
● the code (do-file) that you used for the analysis, with comments for steps on each section;
● the log file automatically generated by your code (text file).
You will have to upload these documents before the deadline on Quercus.
[Note: Please hand in your own solutions]
Non-Experimental Estimates of Effects of Conditional Cash Transfer Programs on Secondary School Enrollment
The goal of this exercise is to evaluate how propensity score methods perform in the estimation of causal effects in comparison to experimental ATT estimates. We will study these questions in the context of the evaluation of the Mexican PROGRESA CCT program in rural Mexico.
You should (again) use the Stata dataset posted on the course website to do this, following the suggestions below.
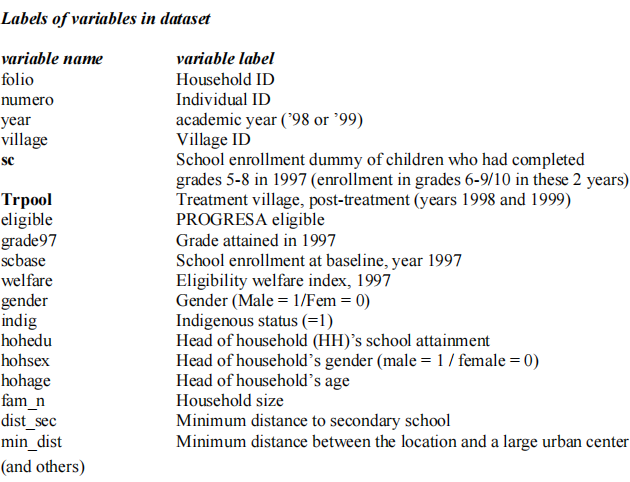
Recall: PROGRESA Program Evaluation Dataset
The PROGRESA program, a conditional cash transfer program initiated by the Mexican government in 1997, provided cash transfers to poor households in rural areas. The transfer was paid to mothers contingent on their children’s primary and secondary school attendance and family visits to health services. The education component of PROGRESA consists of providing subsidies, ranging from $70 to $255 pesos per month (depending on the child’s gender and grade level), to children attending school in grades three to nine of primary and lower secondary school. The program was means-tested, in that households under a certain income poverty line were deemed eligible for the program and others with incomes above the line were classified as ineligible, within each village. Overall, the program transfers were important, representing 10 percent of the average expenditures of beneficiary families in the sample.
A distinguishing characteristic of PROGRESA is that it included a program evaluation component from its inception. PROGRESA was implemented following an experimental design in a subset of communities located across seven states. Among these communities, a subset of villages were randomly assigned into a treatment group, with the remaining communities serving as a control group. Eligible (=1) and ineligible households (eligible=0) were classified in both treatment and control communities.
The data to be used is based on household surveys carried out in the fall of 1998 and the fall of 1999, in the first and second years of the implementation of the program. Each row contains information on the enrollment status of each child who had completed grades 5 through 8 in the villages, in each one of the years 1998 and 1999.
Policy Analysis Problem
(a) Suppose there was no experimental evaluation of the program (in a hypothetical world where we have no data on control group villages). The PROGRESA Program Director asks you to estimate the Average Treatment Effect using children from ineligible households as comparison for the children in eligible households.
Understanding that a simple comparison of the school enrollment rate of eligible and ineligible children will lead to biased estimates of the program’s effects, you propose to the policymaking team to (i) conduct diagnostics of the validity of the research design, and (ii) propose to use propensity-score methods to improve the estimation of ATT program effects.
Questions
(a) Compare the means of baseline characteristics (X’s) of eligible vs. ineligible children in treatment villages, to evaluate the balance of the groups. Interpret the results. [3 pts]
[Hint: use regress command using these baseline characteristics as dependent variables, using option “if Trpool==1”; cluster standard errors at the village level using “cluster(village)” option]
(b) Construct estimates of the propensity score of treatment (eligibility) among children in treated villages. Then, (i) evaluate the balance of observations in the treated and control groups by blocks of the estimated propensity score, and (ii) construct histograms or empirical estimates of the pdf of the estimated propensity score for children in eligible vs. ineligible households in the treated villages. Interpret the results. [4 pts]
[Hints: use pscore command in Stata, and follow the algorithm described in slides 41-42 of the Propensity Score Methods lecture to conduct the diagnostics.1 To generate empirical estimates of pdf’s, use the kdensity command in Stata.]
(c) Construct estimates of the ATT using inverse propensity score weights based on the best set of covariates determined in step (b). Compare these estimates to the non-experimental estimates generated from the simple differences of eligible and ineligible children (in Assignment 1). Interpret the results. [3 pts]
[Hints: use teffects ipw command in Stata using children in treated villages; cluster standard errors at the village level using vce(cluster village) option.
2021-10-30