PS923 - Methods and Analysis in Behavioural Science
Hello, dear friend, you can consult us at any time if you have any questions, add WeChat: daixieit
Homework 4
PS923 - Methods and Analysis in Behavioural Science
Autumn Term
Part 1
Data
The file wb_warwick.csv (on moodle) contains fictitious (i.e., simulated/synthetic) well-being data of 30 students from Warwick. In total the data set has 4 columns/variables.
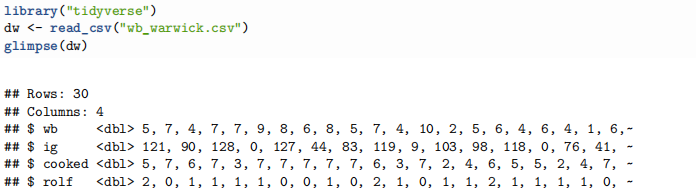
The variables in the data are:
● wb: Subjective well-being score on a scale from 1 to 10.
● ig: Number of Instagram followers.
● cooked: Times the student has cooked instead of eating a ready meal or fast food in the last week.
● rolf: Number of times the student has seen Rolf (the campus cat) in the last week.
The main research question for the data is, which of the 3 independent variables (ig, cooked, rolf) predict the subjective well-being score.
Task 1
Your first task is to set up an individual simple regression model for each of the three independent variables (ig, cooked, rolf) predicting the subjective well-being score in each case. Also, make a plot showing each of these bivariate relationships.
Inspect the plots and results of the regression models to answer the following questions:
● Do any of the plots show a suspicious pattern, which could be problematic when applying linear regression?
● How strong are the bivariate relationships and which of the independent variables is the best predictor for subjective well-being?
● The sigma() function allows extraction of the value of the residual standard deviation. Do so for all models. What does this tell you?
● Write down the regression equation for the models with instagram and with rolf.
● What is the null hypothesis and the alternative hypothesis for the instagram model?
Task 2
Based on the models from task 1, predict the subjective well-being for the following cases:
● For the ig model, predict well-being scores of students with 10, 100, or 200 Instagram followers.
● For the cooked model, predict well-being scores of students with 1, 3, or 6 times cooking.
● For the rolf model, predict well-being for a student who saw Rolf 0, 3, or 7 times.
For each of the predictions, make a judgment (with a reasoned verbal argument) of how much you would trust the respective prediction. Do you have ideas about how to come up with better predictions?
Remember that for calculating predicted values you can use the function (or method) predict, for lm models the method is predict.lm.
Task 3
Visualize the predictions for the cooked model (for only the values of task 2 or for more values) taking the uncertainty of the predictions into account. For this, please use the predict.lm function (see ?predict.lm), which allows you to obtain two different measures of uncertainty, interval = "confidence" and interval = "prediction". Please visualize both levels of uncertainty and try to incorporate them both into one plot. Write one or two sentences explaining the difference between the two intervals.
Part 2
Briefly describe some cases (of different types) where it would be inappropriate, or questionable, to use a linear regression model. Provide examples in each case, highlighting the most relevant assumptions.
Suggested Literature
There is a considerable literature on regression models; you will need to figure out which suits you best.
In terms of literature focusing directly on R, I have three recommendations:
● There are parts on regression in Wickham’s ‘R for Data Science’, Chapter 22 up to 23.4 (http://r4ds. had.co.nz/model-basics.html). However, this is not the regular type of introduction to this topic and leaves out many important things.
● A more traditional introduction is provided in chapter 7 (up to 7.12, 7.12 will be relevant in the coming week) of Field A. P., Miles, J., & Field, Z. (2012). Discovering statistics using R. London: Sage.
● An alternative that is quite nice is the free stats book by Danielle Navarro, Learning Statistics with R: https://learningstatisticswithr.com/ The relevant chapter is 15 (linear regression). Direct link to the book: https://learningstatisticswithr.com/lsr-0.6.pdf
Many good books do not use R, but either just present the theory or use other software.
● A definitive reference for most questions related to regression models in behavioural science is: Cohen, J., Cohen, P., West, S. G., & Aiken, L. S. (2002). Applied Multiple Regression/Correlation Analysis for the Behavioral Sciences. New York: Routledge Academic.
● A more mathematical treatment, but also comprehensive and excellent treatment, is given by: Fox, J. (2015). Applied regression analysis and generalized linear models. Los Angeles: Sage.
● The statistics by David Howell is good, although he uses SPSS rather than R. Both of his books have chapters on regression.
– For those of you who already had statistics classes, try: Howell (2013). Statistical Methods for Psychology, 8th Edition. The relevant part is chapter 9 - Correlation and Regression.
– For those of you with less background in statistics, the better book may be: Howell (2013). Fundamental Statistics for the Behavioral Sciences, 8th Edition. Here the relevant chapters are 9 (correlation) to 11 (multiple regression).
– One benefit of the Howell books are that they also have chapters on the normal distribution, which are also relevant.
2021-10-30