AD685 - MIDTERM EXAM Fall 2019
Hello, dear friend, you can consult us at any time if you have any questions, add WeChat: daixieit
AD685 - MIDTERM EXAM
Fall 2019
10/28/19 – 6:00-7:30 pm sharp
Problem 1. Data were collected from a random sample of 220 home sales from a community in 2013. Let Price = the selling price (in $1000), BDR = the number of bedrooms, Bath = the number of bathrooms, Hsize = size of the house (in square feet), Lsize = lot size (in square feet), Age = age of the house (in years), and Poor = binary variable that is “1” if the condition of the house is reported as poor, and is 0 otherwise. An estimated regression yields:
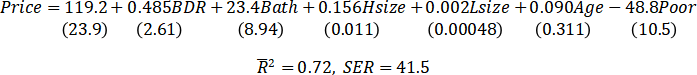
Number in parentheses below each estimated coefficient is the estimated std err (coefficient)
a. (10 pts) What is the predicted price of a house that has 3 BDR, 2Bath, has 2,000 sq ft of living quarters, a lot size of 4,000 sq ft., it is 5 years old and is in good condition? What would be the price of this house if it were in poor condition?
b. (10 pts) Construct a 95% confidence interval (standard normal critical value) for the slopes of BDR and Bath, individually, and check whether they are statistically significant.
c. (10 pts) A colleague of yours posits that the slope on Hsize is “0.20” and that the slope on the Poor indicator is “-50”. Conduct t-tests at 10% significance (Std Normal Crit Value) to tell whether your colleague is right.
d. (5 pts) The output above gives the adjusted R2 (R-bar). Find the raw R2 of the regression.
e. (10 pts) Suppose you run a regression as above, BUT omitting the variables BDR and Bath, and you get a raw R2 = 0.71. Construct an F-statistic to test the null hypothesis that slope(BDR) = slope(Bath) = 0. Use the 5% significance critical value = 3.0 to compare against the F-statistic you got above. Can you reject o not the null hypothesis?
Problem 2. You are considering the risk-return profile of some “Equity Mutual Fund” for investment. The Equity fund promises an expected return of 7% with a standard deviation of 10%. Assume that the returns are normally distributed.
a. (8 pts) Find the probability of earning a return above 9% for the Equity fund.
b. (7 pts) Find the probability of earning a negative return for the Equity fund.
Note: You may round transformed Z-values to 2 decimals so you don’t need to interpolate in the std normal table. Do not round the probabilities read from the table.
Problem 3. Suppose you have some money to invest, for simplicity: $1. You are planning to put a fraction ![]() into a stock market mutual fund and the rest, 1 - w, into a bond mutual fund.
into a stock market mutual fund and the rest, 1 - w, into a bond mutual fund.
Suppose that $1 invested in a stock fund yields ![]() after 1 year and that $1 invested in a bond fund yields
after 1 year and that $1 invested in a bond fund yields ![]() , suppose that
, suppose that ![]() is random with mean 0.07 (7%) and standard deviation 0.06, and suppose that
is random with mean 0.07 (7%) and standard deviation 0.06, and suppose that ![]() is random with mean 0.05 (5%) and standard deviation 0.04.
is random with mean 0.05 (5%) and standard deviation 0.04.
The correlation (r(S,B)) between ![]() and
and ![]() is 0.23.
is 0.23.
If you place a fraction ![]() of your money in the stock fund and the rest,
of your money in the stock fund and the rest, ![]() , in the bond fund, then the realized (observed) return on your investment is:
, in the bond fund, then the realized (observed) return on your investment is: ![]()
a. (10 pts) Suppose that ![]() . Find the portfolio mean return and std deviation.
. Find the portfolio mean return and std deviation.
Remember that Cov(S,B) = Corr(S,B) * sd(B) * sd(S); or: s(S,B) = r(S,B)* s(B) * s(S)
b. (10 pts) Suppose now that the correlation between ![]() and
and ![]() (r(S,B)) is “ – 1” . Find the value of w (stock weight) which will set the risk of the portfolio to zero. Since the variance (and std dev) are never less than zero, you can proceed in EITHER of two ways:
(r(S,B)) is “ – 1” . Find the value of w (stock weight) which will set the risk of the portfolio to zero. Since the variance (and std dev) are never less than zero, you can proceed in EITHER of two ways:
(b.1) Choose “w” to minimize the variance of the portfolio (as done in class for chapter 3).
(b.2) Use the formula of the expansion of this quadratic form:
(aX - (1-a)Y)^2 = (a^2)(X^2) - 2a(1-a)XY + (1-a)^2(Y^2)
Problem 4. The following table gives you the probability distribution of X (last column) and Y (last row) as well as the joint probability distribution of X and Y (inner matrix of 3x5 elements).
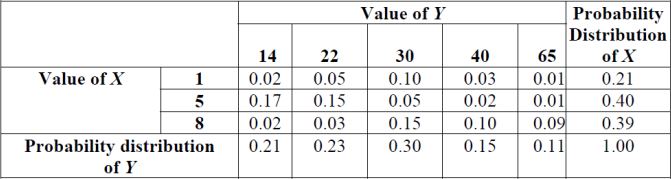
a. (8 pts) Find the mean and std dev of Y
b. (12 pts) Find the conditional mean and conditional std dev of Y given that X=8.


2024-03-04