STAT 230 Computer Assignment 2
Hello, dear friend, you can consult us at any time if you have any questions, add WeChat: daixieit
Computer Assignment 2 (STAT 230)
Fall 2021
Submission: Your Assignment will be submitted in Crowdmark. Before submitting make sure all pages are uploaded to the correct location, are rotated correctly and clear to read. Failure to do any of the above may result in your solution NOT being marked.
Here is a useful link on how to submit Crowdmark assessments:
https://crowdmark.com/help/completing-and-submitting-an-assignment/
Presenting your work: You may type out your work in a text editor such as Word or equation editors such as Latex or R Markdown. You may also submit scans/photographs of handwritten work. If you choose this option ensure your work is clear and easy to read. A combination of typed out and handwritten work is also acceptable.
You must present all R commands you used and their outputs. Someone reading your work must be able to take your commands, copy them into R, and obtain identical results. You must clearly indicate your final answer to each of the questions (presenting R output without clearly indicating what number represents your final answer will not be awarded full points, and will be difficult for our markers to evaluate). Some problems will require using the random number generator in R. When directed, you MUST set the seed of the generator using the command set.seed(ID) where ID should be replaced by your student ID number. Incorrectly seeding the generator when directed will result in a mark deduction.
An example on how to present your solutions is provided on Learn.
Final numerical answers must be presented with at least 3 significant digits after the decimal point. E.g. 0.000120.
External Resources: Collaboration is not permitted on the Assignment. You must work individually. Discussing or sharing any part of the assignment on forums or websites is NOT permitted. Public posts on Piazza regarding general R coding questions is OK. Public posts regarding actual assignment questions is NOT permitted. Accessing the course materials on LEARN is permitted as well as accessing external websites for general R learning.
Using R: The assignment consists of parts to be solved theoretically and parts to be solved using R. Parts to be solved with R are explicitly identified. Please refer to the R tutorial on Learn for relevant R material.
Question 1 (40 marks)
A bag of Halloween candy contains 7 Snickers bars, 4 Bounty bars, and 5 Tootsie rolls (Tootsie rolls, yuck!).
a) Suppose that 5 pieces of candy are drawn from the bag without replacement. What is the probability that the selection will contain 2 or more Tootsie rolls?
b) Suppose that pieces of candy are drawn from the bag with replacement until a Tootsie roll is drawn. What is the probability that this will take 3 or more draws?
c) Suppose that 5 pieces of candy are drawn from the bag with replacment, and let X denote the number of Snickers bars drawn.
i. Write down the probability function of X.
ii. Using R, plot the probability function of X.
iii. Using R, plot the cumulative distribution function of X.
d) Suppose that instead 5 pieces of candy are drawn from the bag without replacment, and let Y denote the number of Snickers bars in a selection.
i. Write down the probability function of Y.
ii. Using R, plot the probability function of Y.
iii. Using R, plot the cumulative distribution function of Y.
iv. Compare the plot of the probabability function of Y to that of the probability function of X computed
in part c). Are they similar or different? Explain in words why this is the case. (A heuristic explanation suffices.)
e) Suppose instead that the bag of Halloween candy contains 700 Snickers bars, 400 Bounty bars, and 500 Tootsie rolls (so many tootsie rolls in one place should be a crime.). Let X now denote the number of Snickers bars among 5 pieces of candy drawn from the bag with replacement, and let Y now denote the number of Snickers bars among 5 pieces of candy drawn from the bag without replacement.
i. Using R, plot the probability functions of X and Y.
ii. Compare these functions to each other and those computed in parts c) and d). Are they similar or different? Explain in words why the probability function of Y now looks more similar to that of X.
Question 2 (30 marks)
Suppose that a law firm is reviewing typed documents as a part of an investigation. It is known that errors introduced into documents by a particular individual, call them suspect A, approximately follows a Poisson process with a rate of 3 errors per 1000 words typed. Note that it will often be helpful to calculate the probabilities below using R.
a) Compute the probability that in a 5000 word document typed by suspect A, there are 20 or more errors.
b) Given that in a 5000 word document typed by suspect A, there are 13 errors, what is the probability that there are exactly 3 errors among the first 500 words of the document?
c) Consider six documents consisting of 1000 words each typed by suspect A (you may assume that the number of errors in each document are independent of each other). What is the probability that exactly 5 of the documents contain at least one error.
d) An investigator reviews independent, 1000 word documents typed by suspect A until they find 3 documents with at least 8 errors. What is the probability that they must review 10 or more documents in order to find the 3 documents they are looking for?
e) How many words would a document typed by suspect A have to be so that the probability that it contains at least one error is larger than 95%?
Question 3 (30 marks)
This entire question uses R. As a part of the investigation in Question 2, the law firm has obtained 14 documents, and has determined the number of errors that they contain and their total word counts. This information is stored in the comma separated file “DocumentSummary.csv”. It is known that each document summarized was typed by one of either suspect A, suspect B, or suspect C. As before, the number of errors introduced to a document by suspect A is assumed to follow a Poisson process with a rate of 3 errors per 1000 words. Errors introduced by suspects B and C also approximately follow a Poisson process with error rates of 1 and 7 errors per 1000 words, respectively. The goal of this question is to try and identify who typed each document.
Begin by reading “DocumentSummary.csv” into R. In order for the following code to work, you must have saved “DocumentSummary.csv” into the working directory of your R session. Otherwise, you can include a full file path.

The object “DocSum” is an R object of type “data.frame”. Data frames normally have names ascribed to their columns, which in this case are

These names are rather cumbersome to work with, so we might change them to something easier:

Now the columns of “DocSum” can be referenced and accessed using the data.frame syntax

a) For each of the 14 documents, compute the probability that suspect A would have produced a document of the given length with the same number of errors. Store these 14 numbers in a vector named “ProbA”, and then print “ProbA”. Do the same thing for suspects B and C, producing and printing vectors “ProbB” and “ProbC”.
b) For each document, determine which suspect had the highest probability of producing a document of the given length with the same number of errors. Produce a vector of characters “A”, “B”, and “C” of length 14 named “MostLikelySuspect”, which encodes for each document the suspect that had the highest probability of producing a document of the given length with the same number of errors. Append this vector as a 4th column to DocSum, and give it the name “Most.Likely.Suspect”.
c) Preamble: Suppose that it is known that the 14 documents studied were drawn at random from a large pool of documents of which suspect A produced 28.57%, suspect B produced 21.43%, and suspect C produced 50%. According to Bayes Theorem,
is equal to
Note that the denominator of the above does not depend on the suspect under consideration, and so when it comes to producing an estimate of the relative likelihood that a particular suspect produced a document given its length and the number of errors, we could just compute the numerator and compare it for different suspects. This numerator is sometimes referred to as the posterior likelihood. This leads to a way of classifying which documents were typed by which suspect: classifying based on the class giving the largest posterior likelihood is known as “Bayes classification”, and is a popular starting point in machine learning methods for classification.
Task: For each document and each suspect, compute the posterior likelihood
P(the document is of legnth x and has y errors| Suspect i typed the document)P(Suspect i typed the document)
. Store these numbers for each suspect in vectors of length 14 named “BayesA”, “BayesB”, and “BayesC”. Print each of these vectors.
d) For each document determine which suspect has the largest posterior likelihood. Produce a vector of characters “A”, “B”, and “C” of length 14 named “BayesClass”, which encodes for each document the suspect that had the highest posterior likelihood of producing that document. Append this vector as a 5th column to DocSum, and give it the name “BayesClass”. Print all 5 columns of DocSum.
Bonus Question (5 Bonus marks)
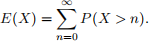
a) Suppose that X is random variable that takes values in the set of non-negative integers. Show that
b) Suppose that X1, ..., Xn are independent discrete uniform random variables on {1, ..., n}, so that the probability function of Xi is f(x) = 1/n, if x ∈ {1, ..., n}, and zero otherwise. Let Yn denote the number of variables starting from X1 that are in strictly ascending order. For example, if X1 ≥ X2, Yn = 1. If X1 < X2, but X3 ≤ X2, then Yn = 2. If X1 < X2 < X3, but X4 ≤ X3, then Yn = 3, etc.. e.g. if n = 5, and X1 = 1, X2 = 3, X3 = 4, X4 = 1, and X5 = 5, then Yn = 3.
c) Calculate P(Yn > k), for k = 0, 1, 2, ..., n.
d) Find limn→∞ E(Yn)
e) Write a simulation in R to check your answer in part d) as follows: Start by setting the RNG seed to your student ID. For n = 100, 100000, 1000000,
i. Simulate variables X1, ..., Xn.
ii. Compute Yn based on the simulated values X1, ..., Xn in part i.
iii. Repeat steps i and ii independently 500000 times to produce 1 million independent replicates of Yn.
iv. Estimate the expectation of Yn by the sample average of these independent copies.
v. Comment on whether or not this estimate appears to be approaching for increasing n the limit you found in part c).
2021-10-30