Programing Assignment 2
Hello, dear friend, you can consult us at any time if you have any questions, add WeChat: daixieit
Programing Assignment 2
Please paste code, produced tables and plots on your solution.
1. Anuran Calls (MFCCs) Dataset was used in anuran species recognition through their calls: https://archive.ics.uci.edu/ml/datasets/Anuran+Calls+%28MFCCs%29. Please find the dataset as “Frogs_MFCCs.csv”. The column “Species” is the true label of the samples, while other columns contain features. (50%)
a. Suppose we do not know the “Species” of the data samples (drop them), please design a K-means clustering model to predict the categories of the samples. Please present how would you determine the number of clusters. (10%)
b. Please design a hierarchical clustering model to predict the categories of the samples. Please plot the dendrogram. (10%)
c. Please build a Gaussian mixture clustering to predict the categories of the samples. Please present how would you determine the number of clusters. (10%)
d. As we discussed at the class, after the clustering, we can consider each cluster as a class and use the class labels as supervised information. Then, we can train a supervised classification model to perform cluster assignment for new data samples. Could you please train a classification model (e.g., decision tree) based on your clustering results on (a), (b), or (c). Then use the model to predict the cluster labels of the new data in “Frogs_MFCCs_new.csv”. (20%)
2. Parkinson Dataset with replicated acoustic features Data Set (http://archive.ics.uci.edu/ml/datasets/Parkinson+Dataset+with+replicated+acoustic+features+) contains acoustic features extracted from 3 voice recording replications of the sustained /a/ phonation for each one of the 80 subjects (Some of them with Parkinson's Disease, i.e., status=1). Please find the data as Parkinson.csv file. (Hint: columns ‘ID’ and ‘Recording’ can not be considered as the features) (50%).
a. Please visualize the data (with label distribution) in 2D PCA space (10%);
b. Please visualize the data (with label distribution) in 2D t-SNE space (10%);
c. Features (i.e., components) extracted by PCA can be also used in downstream machine learning modeling, please extract PCA components which can capture at least 80% variance and use them to build random forest model to predict status of each sample (20%).
d. Now we want to identify sub-groups of Parkinson's Disease (PD) subjects (all subjects whose status=1), Please extract PCA components which can capture at least 80% variance of these PD subjects and use them to build Kmeans clustering model to identify PD sub-groups. (10%)
9. Suppose we have an image illustrated as follows
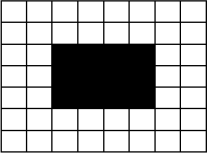
The size of the image is 7x8, where each cell represents a pixel. The image is simply black and white, where the white pixel is with intensity value 255, and the black pixel is with intensity value
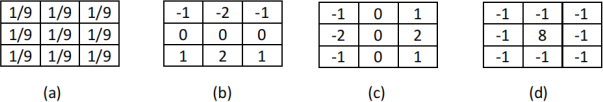
0. If we use the following convolution filter to convolve the entire image, please write down the resultant image after the convolution. Please explain what are the effects of these convolution filters. (20% = 5%x4)
2024-03-04