Real Estate Finance Assignment 1/2
Hello, dear friend, you can consult us at any time if you have any questions, add WeChat: daixieit
Real Estate Finance
Assignment 1/2
Note: Grace TSANG will announce the deadline for this assignment and provide you the instruction for submission. There will be a total of TWO assignments and ALL will be counted toward your final grade. This assignment carries 50 points and represents 5% of your overall grade.
The Excel file “Dataset for Assignment 1” provides the data needed for the assignment.
Question 1: Property Market Bubble Analysis (25 points)
The Excel sheet “Q1. Property Mkt Bubble” contains the median monthly household income by household size, the Prime rate and the property price per square meter for Class B residential properties in Kowloon for the annual period from 2011 to 2020.
Consider the median monthly household income for atypical household with FOUR economically active members. Suppose the household can only commit up to 1/2 of its income to mortgage payment. The usual mortgage terms are 25-year, monthly payments, with mortgage rate equal to Prime Rate minus 2.5%, and 50% down payment. Assume that the household has enough savings to make the 50% down payment for property price.
(a) Determine the maximum home price the household can afford from 2011 to 2020? (5 points)
Hint: Based on the median household income and the mortgage terms, the maximum mortgage an average household can borrow is determined as follows:
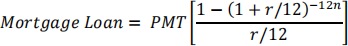
Where r is the annual mortgage rate,n is the mortgage term in year and PMT is the monthly mortgage payment
(b) Suppose the 4-member household wishes to buy and own a class B property in
Kowloon of size 70 square meters. Plot the time series of the affordable home prices calculated in (a) and the corresponding class B property prices for the period from 2011 to 2020. (5 points)
(c) Determine the size of the price bubble for 2017, 2018, 2019 and 2020 calculated in (b). (10 points)
(d) Using the bubble model discussed, determine the market-expected probability that the bubble would NOT burst in 2018/2019 and 2019/2020? (5 points)
Question 2: Property and Capital Market Dynamics (25 points)
Consider the following model for the property and capital market:
• Demand for Office space: D = E(500 − 40R)
• Property Price per sqm ∶ P = i/R
• Construction: P = 100 + 0.000005C
• Stock Adjustment: ∆S = C − δ × S
• Ending Stock of Space = S + ∆S
D is the demand for office space (in sqm),
E is the office employment headcount, which is 2 million.
R is the annual rent per square meter ($/sqm),
i is the annual capitalization rate,
P is the fair value of office space ($/sqm),
C is the annual level of new construction (in sqm),
δ is the annual depreciation rate of stock of space, which is 5%
Currently, the stock of office space available for use is S (in sqm). Given the existing stock of office space, let’s assume that the office market for rent also clears so that D= S
Initially, when the annual capitalization rate is 5.0%, the office market is at long-term steady state equilibrium (initial equilibrium stock of office space (S) is 300 million). So that a stable level of construction will be just enough to replenish the total stock for depreciation, that is, ∆S = 0.
a) Determine the initial equilibrium rent level (R*), price level (P*), construction (C*) and the ending stock of office space (S*). (10 points)
b) Now suppose everything else the same, the annual capitalization rate increases from 5.0% to 5.5% tomorrow.
i. Determine the corresponding property price, construction level, ending stock of space in the period. And the rent in next period before the long-run steady state equilibrium is achieved. (12 points)
ii. Determine the long-run steady state equilibrium property price, construction level, stock of office space and rent. (3 points)
2024-03-02