DSC 148: Intro to Data Mining – Data Mining Winter 2024
Hello, dear friend, you can consult us at any time if you have any questions, add WeChat: daixieit
DSC 148: Intro to Data Mining – Data Mining Challenge
Winter 2024
Challenge Objective
Given the partial dataset of Airbnb listings in New York City, you are asked to design data mining models to build a relationship between the price (dollars per day) and the other observed variables. That is, you are asked to predict the price of the listing, given all its information.
Due date: Feb 29, 11:00 PM PT
Data and Baselines
train.csv: It contains all the training data that you can use in this challenge. The first column “id” provides you the unique key to identify the listings. Different columns show different features/attributes of a listing, including free texts, numerical features, and categorical features. There are also many missing values. So please conduct some exploratory data analyses (EDAs) first before you work on feature engineering.
test.csv: It contains all the listings that you need to predict their prices. The format is the same as the train.csv, except that the price column has been removed.
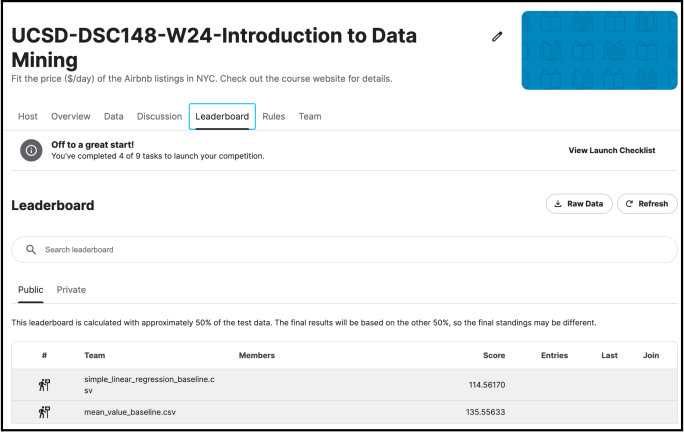
simple_baseline.ipynb: It contains simple baseline methods there. By running this notebook, you will be able to get simple_linear_regression_baseline.csv (leaderboard score: 114.56170) and mean_value_baseline.csv (leaderboard score: 135.55633) as output. The first one is produced by the linear regression model + very simple features. The second one is blindly predicting the mean price based on training data for all listings.
You can download all the datasets and baselines here: http://tinyurl.com/cse148-w24-dmc
Evaluation Metrics
Your predictions will be evaluated against the ground-truth price using the RMSE metric. For each test listing, we will calculate the squared error between the ground truth and your prediction. We will take an average of all listings and then get the square root. For more information, please check this webpage.
Registering your Kaggle Team Name
We will release an assignment to submit your Kaggle username shortly after the challenge starts. You must register your Kaggle username through gradescope to participate in this challenge, otherwise, you will be considered an outsider and your score won’tbe counted towards your overall grade. This username submission is worth 1 point of your challenge grade.
When you upload your submission, you can see your team name under the “Team Name” column. Please submit it.
Note: This is an individual competition and the team name is just the Kaggle terminology here.
Scoring
If you can achieve an RMSE strictly smaller than the “simple-linear-regression” benchmark, you will be able to get 50% of the credits. If you can achieve an RMSE smaller than 100, you will be able to get 40% more of the credits. The remaining 10% will be decided based on your ranking.
Submission Format
You are asked to run your models locally and upload your final prediction file. It is a CSV file with headers of two columns: Id and Predicted. The first character must be capitalized. The first column corresponds to the id in the test.csv file and the second column contains the predicted price.
Once submitted, the system will evaluate a fixed portion (30%, randomly chosen) of the test set and compute RMSE accordingly. Then your score will be displayed on the leaderboard. Please note that the leaderboard during the challenge is NOT final. The final leaderboard will be refreshed once the challenge ends. A new RMSE score will be calculated based on the other 70% portion which has not been tested yet.
Every day, you can make at most 20 submissions. Please start early and make sure you have enough time to tweak your models and hyperparameters. You will be able to choose 2 submissions for the final evaluation and the system will pick the best score you have.
2024-02-29