Data Structures and Algorithms Project 3
Hello, dear friend, you can consult us at any time if you have any questions, add WeChat: daixieit
Data Structures and Algorithms
Project 3
Graph Coloring and Red Black Trees
Due: February 27, 2024
A coloring of a graph is an assignment of a color to each vertex of the graph so that no two vertices connected by an edge have the same color. The problem of coloring of graphs has been studied for many decades. Unfortunately, coloring an arbitrary graph with as few colors as possible is one of a large class of problems called “NP-complete problems”, for which all known solutions are essentially of the type “try all possibilities”. In the case of the coloring problem, “try all possibilities” means to try all assignments of colors to vertices at first one color, then two colors, then three, and so on. It is generally believed that no algorithm to solve this problem can be substantially more efficient than this most obvious approach1 .
While finding an optimal solution may require too much computer time, we may be able to get a ‘close to optimal’ solution in a reasonable amount of time.
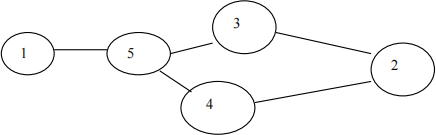
Consider two ways we could color the graph below.
1) Color 1 Red, Color 2 Red, Color 3 and 4 Blue, Color 5 Yellow.
2) Color 1 and 3 and 4 Blue, Color 5 and 2 Red.
While both are legal colorings, only the second is optimal.
The following algorithm uses a greedy heuristic to color a graph. This algorithm does not necessarily produce optimal solutions.
Procedure greedy(G : Graph, newclr : Set)
// greedy assigns to newclr a set of vertices of G that may be given the same color
newclr = empty set
for each uncolored vertex v of G do
ifv is not adjacent to any vertex in newclr
mark v colored
add v to newclr
This program is a refinement of the greedy algorithm on page one.
Procedure greedy (G : Graph, newclr : LIST)
// greedy assigns to newclr those vertices that may be given the same color
bool found
int v,w
newclr = emptyset
v = first uncolored vertex in G
while v <> null
found = false
w = first vertex in newclr
while w <> null
if there is an edge between v and w in G then
found = true
w = next vertex in newclr
if found == false
mark v colored
add v to newclr
v = next uncolored vertex in G
An application of graph coloring
Write a program that reads a data file containing a list of student class schedules. The name of the data file will be entered on the command line. The output of your program will be (a) a two dimensional matrix that represents the graph and (b) a final exam schedule. The format of the input file will always be as follows:
<student name> <N> <course name 1> <course name 2> … <course nameN> <return> <student name> <K> <course name 1> <course name 2> … <course nameK> <return> :
:
Each students name is in the form <last name>,<first name> with no intervening space characters . The course names are all 6 characters in length and are separated from each other by spaces. Each course name refers to a single section of the course and for each course, only one section is offered. (It’s a small school.) The number after the student’s name represents the number of courses the student is taking. There is no need to validate the file. We will assume that it has already been validated.
There is a maximum of 40 students on the file. No student may take more than 5 courses. There is a maximum of 20 different courses offered each term.
Your program must build a graph from the data on the file. Process the graph with the greedy algorithm shown above and display a schedule of final exams. Final exams must be scheduled in such a way that no student has a conflict. For example, if Sue is taking both ENG040 and MAT100 then the final exam for
each of these courses must be scheduled at a different time. Sue cannot be in two places at once.
The output of your program must be in the following form:
Final Exam Period 1
<course name >
<course name >
Final Exam Period 2
<course name >
Final Exam Period P
<course name >
Dictionary Implemented as a Red Black Tree
You must use a dictionary to differentiate between those course names that we have previously seen on the file and those that the program is encountering for the first time. The basic idea is to read the course name and check the dictionary to see if the name has been seen before. If it’s a new name, we need to assign to it an integer that will be used to represent the course in the graph. If it’s an old name, we need the dictionary to tell us what integer was assigned to that name.
For example, the first course name read will be assigned the number 0. Why ? Well, we looked in the
dictionary and it was not there. So, we assigned this course the number 0. The second course name will be assigned the number 1 (if it is a different name than the first). If it’s the same name as the first then we can retrieve its number from the dictionary, i.e., 0.
The dictionary itself will be implemented as a Red Black Tree of name value pairs. The name will be the course name and the value will be an integer – assigned sequentially as discussed above.
On the class schedule is the Javadoc specifications for two classes: RedBlackNode.java, and
RedBlackTree.java. You are required to implement the insert method along with any additional methods
that are appropriate for this project. If you need additional or modified methods, feel free to add or modify them. You are not required to implement methods found in the Javadoc that are not needed for this project. The implementation must be adapted to handle name, value pairs.
Example Data File
Smith,Al 2 mat100 che080
Jones,Sue 2 eng040 mat100
Bell,Amy 2 eng050 gym000
Gingrich,Fred 3 gym000 his098 eng040
The following graph would be constructed in an Adjacency Matrix:
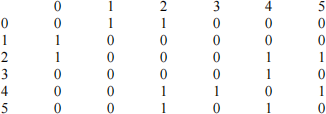
An array of strings would also have been constructed that looks like the following:
0 → mat100
1 → che080
2 → eng040
3 → eng050
4 → gym000
5 → his098
After displaying the matrix and coloring the graph, the program would produce the following exam schedule:
Final Exam Period 1 => mat100 eng050 his098
Final Exam Period 2 => che080 eng040
Final Exam Period 3 => gym000
The following code may be of use when reading the input file:
// IO Demo
import java.io.*;
import java.util.*;
public class InputDemo {
public static void main(String args[])
{
try{
BufferedReader in =
new BufferedReader(
new FileReader(args[0])
);
String line;
line = in.readLine();
while(line != null) {
processLine(line);
line = in.readLine();
}
}
catch(IOException e) {
System.out.println("IO Exception");
}
}
public static void processLine(String line) {
StringTokenizer st;
// use space, and tab for delimeters
st = new StringTokenizer(line, " \t"); // use split if you prefer
while (st.hasMoreTokens()) {
System.out.println(st.nextToken());
}
}
}
Submission Requirements:
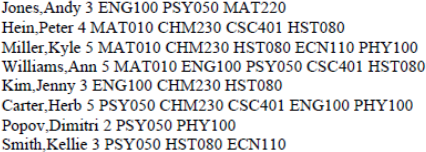
Run your solution on the following input file:
Jones,Andy 3 ENG100 PSY050 MAT220
Hein,Peter 4 MAT010 CHM230 CSC401 HST080
Miller,Kyle 5 MAT010 CHM230 HST080 ECN110 PHY100
Williams,Ann 5 MAT010 ENG100 PSY050 CSC401 HST080
Kim,Jenny 3 ENG100 CHM230 HST080
Carter,Herb 5 PSY050 CHM230 CSC401 ENG100 PHY100
Popov,Dimitri 2 PSY050 PHY100
Smith,Kellie 3 PSY050 HST080 ECN110
Your program will display an adjacency matrix corresponding to the input. Include a screen shot showing the adjacency matrix output produced by your program.
Your program will find and display a schedule for final exams. Include a screen shot showing this final exam schedule.
Place the screenshots and result.txt (described below) and all project related source files in a single
directory and zip that directory. The file will be named <yourandrewID>Project3.zip. For example, if I were to submit project 3, it would be named mm6Project3.zip. Submit one zipped directory to Canvas.
Your source code must include your name and Andrew ID at the top of each class file. The source code will be well documented. Variable names will be well chosen and the code will be easy to read.
result.txt![]()
Your Project should include code to generate a text file named result.txt. If you need help, you can refer to this website on how to use PrintWriter.
This file itself should also be included in your submission zip.
This file will be used for auto-grading, so please be careful with the formatting instructions below. The file would look similar to this:

1. First line contains your Andrew ID, nothing else.
2. Line 2 onwards contains the adjacency matrix representation for the dataset given in assignment (repeated below)

3. After the adjacency matrix for above test is printed, add a line break and print the
schedule (can be seen in lines 9-11 for this example) that you construct from data in
Step 2. Take note of the format. The period and the subjects are separated by this string (ignore the quotes):
‘ => ’
4. In the sample screenshot, the same output has been repeated. But in your submission, line 13 onwards, your code will write the output for the second dataset in the assignment (repeated below)
5. First write the adjacency matrix in a similar format as shown.
6. Add a line break.
7. Write the schedule in a similar format as shown.
2024-02-29
Graph Coloring and Red Black Trees