Nonlinear econometrics for finance HOMEWORK 3
Hello, dear friend, you can consult us at any time if you have any questions, add WeChat: daixieit
Nonlinear econometrics for finance
HOMEWORK 3
GMM, MLE and Volatility
Problem 1. (45 points) Return to the first problem in Assignment 2. Consider, again, the Cobb-Douglas production function:

where qt is output/production, kt is capital and lt is labor. Assume E(εt|kt, lt) = 0.
Questions:
1. (15 Points) You have already estimated the model with NLS. Now, you will estimate it with GMM. Adapt the code “gmm-vs-nls” to es-timate the model in Eq. (1) using GMM and, again, the Mizon data. Report (1) estimates, (2) standard errors and (3) t-statistics for the three parameters and comment on the statistical significance of your estimates.
Note: You should choose four moment conditions. In other words, you should estimate an over-identified model.
2. (10 Points) Evaluate “constant returns to scale” by testing H0 : θ2 + θ3 = 1 using the GMM estimates.
3. (10 Points) Evaluate “constant returns to scale” by testing H0 : θ2 = 0.2 and θ3 = 0.8 using the GMM estimates.
4. (10 Points) Implement Hansen’s test of over-identified restrictions.
Problem 2. (25 points) Consider a sample (x1, x2, ..., xT ) of Bernoulli random variables with T observations. As you know from your statistics classes, these are random variables which take on the value 1 with probability p and the value 0 with probability 1 − p. Hence,
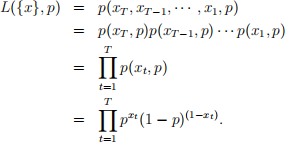
Note that p(xt , p) = p xt (1−p) (1−xt) because, if xt = 1, we obtain p. If xt = 0, we obtain (1 − p).
Questions:
1. (5 Points) Write the standardized logarithmic likelihood for this model.
2. (20 Points) Adapt the code “mle-Normal” to (1) define a Python func-tion for the standardized log-likelihood, (2) estimate the single param-eter p and (3) compute standard errors for your estimate with the two methods discussed in class (i.e., with Ω0 and with B0).
Problem 3. (30 points) Estimate a GARCH(1,1)-M model by ML using the data in S&P500daily-level.xlsx:
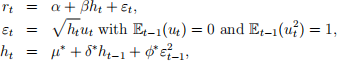
Assume the errors (ut) are normal.
Questions:
1. (25 points) Modify the code “mle-GARCH” to estimate this model. Compute (1) parameter estimates, (2) standard errors and (3) t-statistics. Report all figures in a table.
2. (5 points) Plot the time series of the conditional variances. Do you see any interesting event?
2024-02-29