ECN 310 Latin American Economic Development Problem Set 1 Spring 2023
Hello, dear friend, you can consult us at any time if you have any questions, add WeChat: daixieit
ECN 310
Latin American Economic Development
Problem Set 1
Spring 2023
1. Measuring Development
Use gapminder’s data (https://www.gapminder.org/tools/) to answer the following questions.
a.) What’s the relationship between GDP per capita (PPP$, inflation adjusted) and life expectancy?
b.) Name a country that in 2022 had a similar level of GDP per capita (PPP$, inflation-adjusted) as Honduras and Nicaragua but much lower life expectancy.
Hint: The figure uses green dots for countries in the Americas and the Caribbean.
c.) Describe the relationship between GDP per capita and mean years in school for women ages 15-24.
Hint: click the y-axis label -> Education -> Mean years in school -> Women 15 to 24
d.) Describe the relationship between GDP per capita (PPP$, inflation adjusted) and the gender ratio of mean years of schooling and GDP per capita (PPP$, inflation adjusted).
Hint: click the y-axis label -> Education -> Gender Equality -> Gender ratio of mean years in school (women % men, 25 to 34 years).
e.) Describe the relationship between GDP per capita (PPP$, inflation adjusted) and the Corruption Perception Index
Hint: click the y-axis label -> Society -> Corruption Perception Index
f.) Describe the relationship between GDP per capita (PPP$, inflation adjusted) and internet users.
Hint: click the y-axis label -> Communication -> Internet users
g.) Describe the relationship between GDP per capita (PPP$, inflation adjusted) and CO2 emissions (metric tons of CO2 per person)
h.) How do the following exercises inform how you think about the role of income and development (defined broadly)? (1-3 sentences)
2. Economic Growth
Use the World Bank data to help answer the questions below.
For data on GDP per capita (current US$): https://data.worldbank.org/indicator/NY.GDP.PCAP.CD
For data on GDP per capita, PPP (current international $):
https://data.worldbank.org/indicator/NY.GDP.PCAP.PP.CD
a.) Using the most recent data from the World Bank, find and report the “GDP per capita (current US$)” and the “GDP per capita, PPP (current international $)” for your group’s Latin American country (if you haven’t decided on one, pick a Latin American country for this exercise). Then do the same for Germany.
b.) How many times larger is your country’s PPP GDP per capita relative to its non-PPP GDP per capita? What about Germany? Is the PPP difference in your group’s country larger or smaller than the difference for Germany? Explain why this is the case.
c.) Calculate the implied annual growth rate of PPP GDP per capita for your group’s country and for Germany from 2008-2018.
Hint: This requires using the exponential growth formula from lecture.
d.) Based on this average annual growth rate over 2008-2018, approximately how long would it take for your group’s country to double in size?
3. Data- Inequality
Using the World Bank data on Gini measures across countries over time (gini_world_bank.xls), answer the following questions.
a.) Find and report a Latin American country that has seen decreasing inequality as measured by the Gini coefficient.
b.) Find and report a Latin American country that has not seen decreasing inequality as measured by the Gini coefficient.
4. Understanding Measures of Inequality
a.) Suppose that in country A the “bottom” 60% of the population receives 20% of the country’s income. The “top” 40% receives the remaining 80% of the country’s income. What is the Gini index in country A?
Hint: Graph the Lorenz curves. Connect points using straight lines and then use geometry.
b.) Suppose that country B has a population of 5,000 households and a poverty line of $15,000. 4,000 households have expenditure levels of $10,000, below the poverty line of $15,000, while the remainder of households have expenditures above the poverty line. What is the poverty headcount ratio for this country?
c.) What do you think happens to most measures of inequality (no calculation needed, just the direction) and to the poverty headcount ratio if the 4,000 poor households transfer $2,500 (through the tax system) to the richer households?
d.) Suppose that economic growth eventually doubles everyone’s income. How would this change this country’s Gini Coefficient? Its Poverty Headcount Ratio?
e.) You are a politician who has been told that your country will continue to receive World Bank development aid as long the poverty head count ratio drops below 50%. Currently you have three groups, each of size 10: the very poor with incomes of $100, the less poor with incomes of $900, and the rich with incomes of $10,000. The poverty line is at $1,000. You have $1,000 you can distribute in development aid. Assuming diminishing marginal utility of wealth (i.e., the additional benefits of more wealth get smaller and smaller the wealthier you get), who needs this help the most? If you wanted to keep getting the World Bank aid, who would you give the money to? If the World Bank instead used the poverty gap index to measure poverty, would we still have this problem?
5. Solow Model
Suppose an economy follows the Solow growth model with constant investment, depreciation and population growth rates. Predict the effects of each of the below policy changes in this economy on per capita income levels (GDP per capita) and on GDP per capita growth rates separately, both in the short-and long (~infinite) run.
a.) Suppose there is no technological progress and the economy is at its current steady state level of per-capita income. Suppose that the due to both increased corruption and a reduction in enforcement of private property laws through government seizures, incentives to save for the future diminish, suddenly reducing this country’s savings rate.
b.) Suppose there is 1% technological growth each year and the economy is on its steady-state growth path (i.e., balanced growth path). The government vastly increases research and development spending which eventually succeeds in inducing a higher rate of technological growth (i.e., π > 0.01).
Hint: It may help to draw the balanced growth paths and the evolution of log income per worker over time.
Let’s take a Solow model with no technological progress and the following production function: Yt = AKt4/1Lt4/3. Hence, output per worker can be written as: yt = AKt4/1 where kt is capital per worker. As discussed in class, the following equation describes the evolution of capital: (1 - δ) + sYt. Some algebra shows that this can be expressed as: 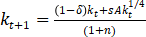 .
.
a.) Express the steady state level of output per worker (y*) as a function of A, s, n, and δ. Show that this expression is: 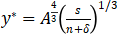 .
.
Hint: It might help to first solve for the steady-state level of capital per worker (k*)
b.) Suppose both the U.S. and Chile have the production function above, a savings rate of 20%, a population growth rate of 2%, a depreciation rate of 7%, and A=3,000. Suppose further that the U.S currently has a GDP per worker of $55,000, while Chile has a GDP per worker of $16,000. What does the model predict will happen in each country over time?
c.) Now consider a different Solow Model with technological progress at the rate of 2% (i.e., π = 0.02. Suppose the U.S. is on its balanced (steady-state) growth path. Will the growth rate of output per in the U.S. worker be larger, smaller, or equal to 2%? Explain.
d.) Suppose the progress rate is the same in Chile (π = 0.02. Will the growth rate of output per worker in Chile be larger, smaller, or equal to 2%? Explain.
e.) Explain why the growth rate of output per worker in Chile is different than in the U.S. Hint: This may have to do with differences in current levels of capital/income per worker.
f.) Nicaragua’s GDP per capita is $2,000. In contrast to the U.S. and Chile, Nicaragua’s savings rate has been low (especially in the last few years), with an average of around 10% in the last 30 years. Is Nicaragua’s steady-state output per worker larger, smaller, or equal to that of the U.S. and Chile?
g.) Suppose Nicaragua is above its steady state level of output per worker. Draw the balanced (steady-state) growth paths and each country’s actual growth path for U.S., Chile, and Nicaragua. The vertical axis of your graph will be log (GDP per capita) and time (in years) will be on the horizontal axis.
Hint: Is Chile above or below its steady-state growth path? It has the same savings, population growth, depreciation, and technological progress rates as the U.S. What about Nicaragua?
h.) Does the graph you drew in f.) match up with what we’ve seen with these countries’ patterns of economic growth since the 1980s? Check using the World Bank data: https://data.worldbank.org/indicator/NY.GDP.PCAP.CD
You can also check using the “Our Worldin Data” site: https://ourworldindata.org/grapher/gdp-per-capita-maddison?tab=chart
i.) The Solow Model is a powerful tool to begin conceptualizing the forces that shape economic growth. In your opinion, what is the major limitation of the model we discussed in class? Feel free to list several limitations/issues.
2024-02-20