EEE118 LED Lab Part 1 2023-24
Hello, dear friend, you can consult us at any time if you have any questions, add WeChat: daixieit
EEE118 LED Lab Part 1 2023-24
CCEE319
EEE118 LED lab Part 1 – Electrical characterisation of LEDs
1 Introduction
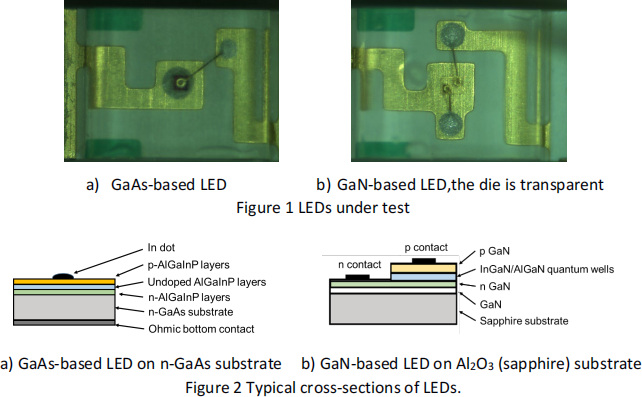
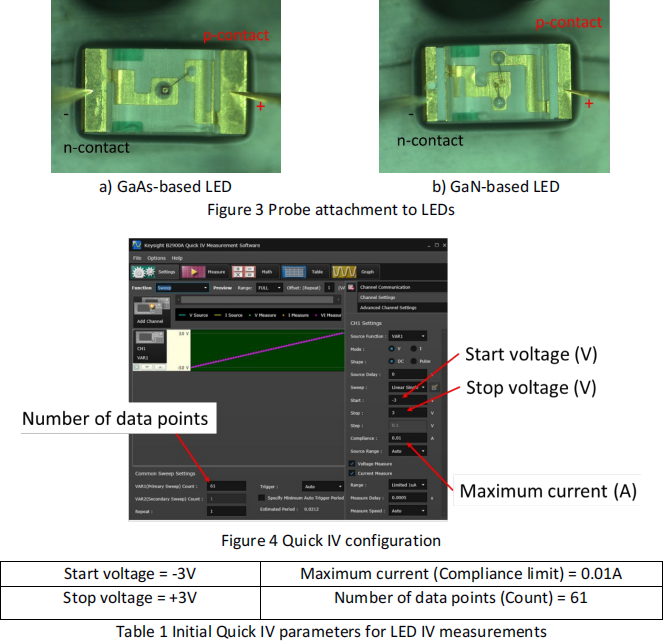
In this laboratory class you will measure the electrical behaviour of two light emitting diodes (LEDs) (Fig.1). The two LEDs are based on the III-V semiconductors GaAs and GaN. The deposition of sub-micron layers of negative type (n), positive-type (p) and undoped (i = intrinsic) material on a thick substrate layer (Fig.2) enables the formation light-emitting p-i-n diodes [1].
2 GaAs-based LED measurement
In order to characterise the GaAs-based LED we first need to make electrical contacts to the p- and n-type regions Crocodile clips are too big (!), so instead we will use a Probe Station
connected to a programmable DC power supply (Source Measure Unit - SMU). Before you start, please watch a live demonstration from the teaching staff, (a video demonstration is also available on Blackboard), then proceed as follows:
. Place the glass slide with your sample on the Probe Station table.
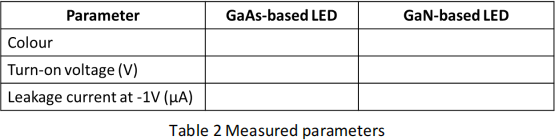
. Carefully lower the negative (-) probe onto the n-contact (Fig3a).
. Carefully lower the positive (+) probe onto the p-contact (Fig3a).
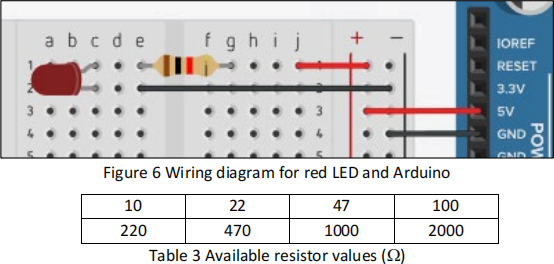
. Configure the SMU using the Quick IV software (Fig.4) with the parameters in Table 1
. Click Measure to record an IV sweep
. Click Graph to display the graphical results
. Click Table, and then right click on the data and save the data as a .CSV (comma- separated variable) file. This data format can be read by Excel, MATLAB, etc.
. Email the data to yourself and your lab partner – you will need it for the post lab.
. Carefully raise the probes and remove the LED from the probe station table
3 GaN-based LED measurement
Use the procedure in Section 2 to measure the IV curve for the GaN-based LED. Note that the GaN-based LED has been grown on an insulating sapphire substrate. This means that both contacts must be made to the top surface of the device, as shown in Fig.3b.
4 Data analysis
. Sketch the IV curves for the two LEDs in the blank Fig.5
. Record the measured parameters in the blank Table 2
Note: this graph and this data table will be needed for the post-lab

Figure 5 Sketch of the measured I-V curve for GaAs and GaN-based LEDs
5 Supplementary exercise
Perform this supplementary exercise if time allows.
• Measure the IV curve of a packaged red LED.
• Calculate the LED’s internal on state resistance Ron using (1)

• To avoid overheating during operation, the current through the LED (I) must be
limited to a maximum 10 mA. Using (2), calculate the value of the series resistor Rs that needs to be used when the LED is powered from the 5V DC supply from an Arduino (Fig.6).

• Ask a member of staff for the appropriate resistor from the list in Table 3, then build and test the circuit
• Reconfigure the circuit so that the codeherecan be used to control the brightness of the LED
2024-02-20
Electrical characterisation of LEDs