CS 3200 Assignment 2 Solving Linear Equations and Regression
Hello, dear friend, you can consult us at any time if you have any questions, add WeChat: daixieit
CS 3200 Assignment 2 Solving Linear Equations and Regression
Assigned: 1-29-24 Due Date: 2- 11-24
Note: For all questions you should use the supplied Matlab codes for as a starting point. The code must compile on one of the lab machines with your instructions. Document your code thoroughly!
1. This question on the Filip” data set is a somewhat modified form of question 5.10 of Cleve Moler’s book. The data consist of a few dozen observations of a variable y at different values of x. The task is to model y by a polynomial of different degrees from degree 10 upwards in x.
This data set is controversial. A search of the Web for “filipstrd” will find several dozen postings, including the original page at NIST, the National Institute for Standards and technology. Some mathematical and statistical packages are able to reproduce the polynomial coefficients that NIST has decreed to be the “certified values.” Other packages give warning or error messages that the problem is too badly conditioned to solve. A few packages give different coefficients without warning. While the data set is available from the NIST Website, this data file is also on the canvas page .There is one line for each data point. The data are given with the first number on the line a value of y, and the second number the corresponding x. The x-values are not monotonically ordered, but it is not necessary to sort them. Let n be the number of data points and p = 11 the number of polynomial coefficients. Here is matlab code to read the data
fid = fopen('NIST_Filip_trim.txt','r');
x = zeros(82,1);
y = zeros(82,1);
yy = zeros(82,2);
ii = 0;
while ~feof(fid)
ii=ii+1;
tline = fgetl(fid);
% code to format/store tline
AAA = sscanf(tline,'%f %f');
yy(ii,1)= AAA(1,1);
yy(ii,2)= AAA(2,1);
% fprintf(' ii=%i y= %f x= %f \n',ii,yy(ii,1),yy(ii,2))
end
fclose(fid);
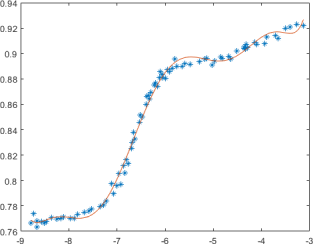
(a) As your first experiment, use the code to read this data file and sort it and plot it . You should see something like the figure of sample output below.
[10 Marks]
(b) [10 Marks] Use a linear scaling to put both x and y values in the range [-1,1] such
as 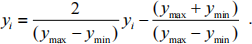
(c) Write a program that uses the Monomial Vandermode matrix approximation to produce a least squares approximation to work with this data set. In this case n=82 as there are 82 data points and m is the degree of the polynomial with m+1 terms. Use values of m equal to 5,10, 15, 20, 25. . Plot the values of the polynomial by evaluating the Vandemonde polynomial at (say) 1001 points and use plots to show how the different polynomials behave. Contrast the visual appearance of the polynomial in each of the five cases m = 5,10,15,20,25 Use the supplied regression code on the canvas page as a model if you find that helpful.
An easier option is to use the matlab functions polyfit and polyval. If you use these you will not be able to estimate the condition numbers of the matrices. Instead matlab will tell you that the matrix is ill-conditioned.
[20 marks]
(d)In each of the five cases calculate the least squares error 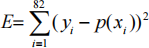 where yi are the data values at points xi and p(xi ) are the
calculated values of the least squares polynomial. Compare the errors with the cases in which Matlab has problems with the equations as evidenced by a condition number error message.
Note that the distance between the least squares polynomial and the data may not change all that much as the polynomial degree is varied from 5 to 25 .
[10 marks]
2. [50 marks] In this problem, you will build your own bridge and see for yourself why
solving systems of equations with accuracy and precision is important. You must build a
bridge using this toolthat looks like any of the following:
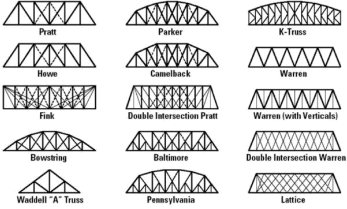
Feel free to use your imagination and creativity to build interesting structures. It is highly recommended that you play around with the tool to get comfortable using it. Think about where the forces on the bridge could be acting on. A quick google search on trusses and types of ‘supports’ and ‘forces’ used in bridges will get you up to speed on how to declare them in the simulator. Feel free to experiment and create!
Once you are done building your bridge, click on ‘Show matrix eqns’ and you should be able to see all matrices which give you information about everything. It’s in the form Ax = b. ‘A’ tells you about how members, supports, and nodes are connected in 2D space. ‘B’ tells you the forces acting on nodes [+/- tell the directions], and the ‘x’ tells you the forces acting on different members, supports, etc. When building real bridges, one can approximate A and B to calculate ‘x’. It is very important that engineers know how much force each member and support experiences so that an appropriate material in the required dimension is used. [In real world, engineers use reasonably good approximations to account for all conditions while declaring both A and b, however real- world conditions can be very hard to quantify accurately.]
Now, copy matrix A and b. Assume that you do not know ‘x’. Implement a MATLAB program to compute ‘x’ using any technique of your choice in MATLAB. Write a detailed explanation using the ideas explored in the question to explain your results here and uncertainties that could be involved in them. Please include your constructed bridge pictures in the report as well. Speculate and write about the number of equations that one would have to solve while building a real-world bridge, and the challenges involved in solving them. [Note: if you don’t feel comfortable using the tool and creating your own structure, select pre-built truss number ‘3’ and solve for it.]
What to turn in
For this assignment, we expect both SOURCE CODE and a written REPORT be uploaded as a zip or tarball file to Canvas.
• Source code for all programs that you write, thoroughly documented.
o Include a README file describing how to compile and run your code.
• Your report should be in PDF format and should stand on its own.
o It should describe the methods used.
o It should explain your results and contain figures.
o It should also answer any questions asked above.
o It should cite any sources used for information, including source code.
o It should list all of your collaborators.
This homework is due on February 11th by 11:59 pm. If you don't understand these directions, please use Zoom office hours , send questions to me at [email protected] or contact the TAs.
2024-02-19