EEE118 LED lab Part 2
Hello, dear friend, you can consult us at any time if you have any questions, add WeChat: daixieit
EEE118 LED lab Part 2
Supplementary information for Virtual Lab
This document should be read with reference to the lab sheet and using the data file entitled ‘EEE118 virtual lab spectra.xlsx’.
2.1 White light generation
You can simulate this section using Tinkercad.
2.2 Optical spectra
Fig.1-3 show the spectra of the R, G and B LEDs. Use these graphs to estimate the emission peak wavelength and line width for each LED. Tab1 of the data file contains these spectra.
Tab2 of the data file contains three sets of data for different ‘perfect’ white lights. The numbers in row A indicate the RGB PWM numbers. Use one of these data sets to complete 2.2.8.
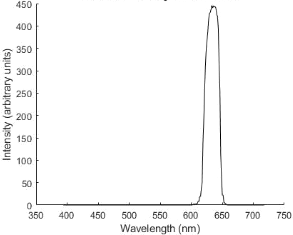
Figure 1 Red LED optical emission spectrum
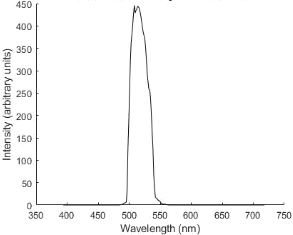
Figure 2 Green LED optical emission spectrum
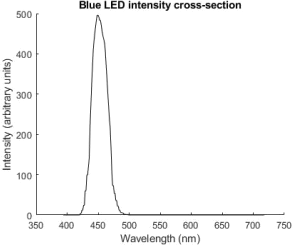
Figure 3 Blue LED optical emission spectrum
2.3 CIE colour space coordinates
Use the data generated in the preceding sections to complete this section.
2.4 White LED
The emission spectrum from a white LED is shown in Fig.4. You should model this as two LEDs, with one of the LEDs having a large width (as indicated by the dashed line). The white LED spectrum is contained on Tab3 of the data file.
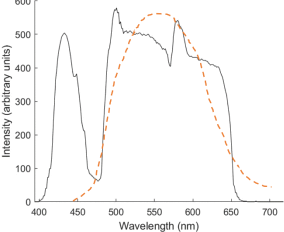
Figure 4 White LED optical emission spectrum
2024-02-19