DATA71011 Understanding Data and their Environment
Hello, dear friend, you can consult us at any time if you have any questions, add WeChat: daixieit
DATA71011 Understanding Data and their Environment
Coursework Project
This coursework project is mainly concerned with data pre-processing for a sales forecasting problem across different stores in the retail industry. The task involves the analysis of historical sales data collected from a large drug store chain in Europe (R®SSMANN chain in Germany). The aim is to expose you to a realistic business case and to gain understanding and insight about some of the ways in which data can be fully prepared to optimise its analytical value.
Assessment and submissions
. Formative presentation slides on your group’s analysis plan should be emailed to [email protected] by 3:00pm the day before your presentation (which will take place in Week 12). Oral feedback will be given in the class.
. Deadline for individual report (55% of the marks for the module) submission:
3.00pm 9th February 2024
Please find further requirements and tips in the following pages.
Description of the business context
Accurately forecasting sales is one of the most difficult challenges faced by retailers worldwide, as sales are influenced by many factors, such as promotions, competition, holidays, seasonality and locality. In this project, the overall business objective is to predict 6 weeks of daily sales for 1,115 drug stores located across Germany, as reliable sales forecasts enable store managers to increase the overall productivity and profitability of the retail business and improve their customer satisfaction.

However, the challenges in this sales forecasting problem are to take into account various types of factors and to deal with missing data from historical records. Thus, you are commissioned to get the historical dataset fully pre-processed for reliable and accurate forecasting, and the major data preparation tasks, like integration, visualisation, cleaning and transformation, should be explored. The available datasets are briefly introduced below.
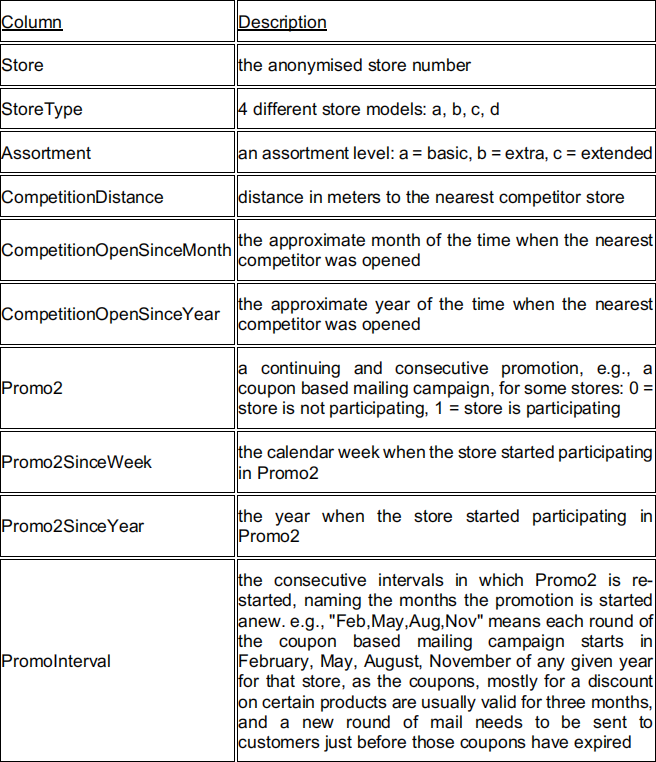
. stores.csv
This excel file contains the supplementary information for the 1,115 drug stores.
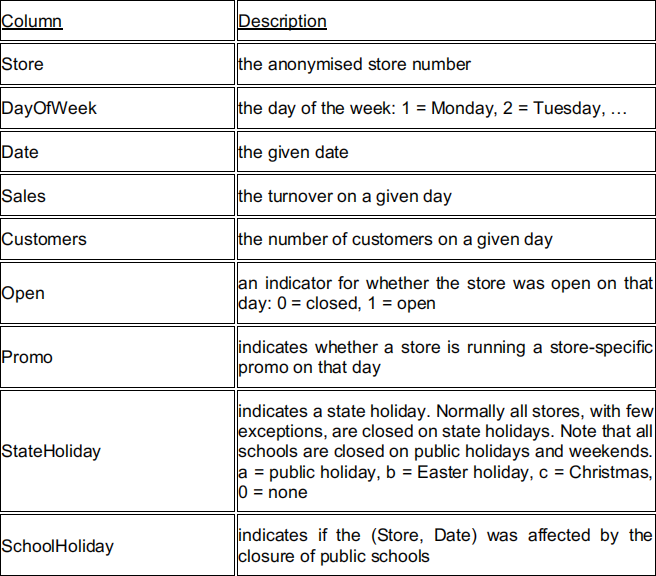
. train.csv
This file contains the historical sales data, which covers sales from 01/01/2013 to 31/07/2015. It includes the following fields:
. test.csv
This file is identical to train.csv, except that Sales and Customers are unknown for the period of 01/08/2015 to 17/09/2015.
Evaluation of forecasting accuracy
In this project, the following Root Mean Square Percentage Error (RMSPE) or other appropriate errors can be used to evaluate forecasting accuracy, if you wish to build a forecasting model on the pre-processed datasets.
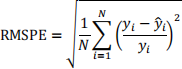
where N is the total number of data records for accuracy evaluation, y! is the actual sales for the i-th record, and y(.)! is the sales forecast for the i-th record. Note that zero actual sales should be dealt with appropriately.
General requirements:-
You are expected to collaborate with your group members to understand the business problem and lay out the data pre- processing plan for formative feedback, before you complete a report (length: 1500 words) for assessment individually.
Your work should cover (but not be limited to) the following.
- Review the available data and describe it in terms of its variables, quality, and relevance to the sales forecasting,
- Link data sets together as appropriate,
- Pre-process the data as appropriate for further analytics, for example, you may want to encode any categorical data, create new variables, identify how many missing values there are and deal with them appropriately, etc.
- Identify the key factors affecting sales, for example, you may want to check whether competition and promotions have an impact on sales, and how public holidays cause sales fluctuations.
- Build a forecasting model (which can be a linear regression model, a neural network model or something else) using the variables you identified. Please make sure to justify the choice of your modelling approach.
- Interpret key results, assumptions and limitations of your analysis.
Some tips for writing the report
. Imagine that you are writing the report for someone to read not simply to pass the course!
. A report should include an introduction and a conclusion. Marks are available for these two sections.
. A good report is a narrative; not simply a reporting of what you did.
. Your goal is to communicate your findings not simply to churn out the analyses.
. The steps above are components that should be included in the analysis and reporting; how you include them is up to you. Reports that simply use the task descriptions above as
headings will lose marks.
. Distinction level reports tend to go beyond the specification – adding extra ideas connections /analyses or ways of presenting the data that are not specified above. I view these favourably (as long as they are well done!) but they are not essential.
. Put some effort into the layout and presentation – these are easy marks.
. Exploratory analysis should be included in the main report where appropriate and where it adds to the narrative. Assumption test output can be included in the appendices as can
any exploratory analysis which adds to the story you trying to tell but would clutter up the main body of text.
. Strike the right balance between too few and too many charts and tables. One-two per page (depending on size) is a good rule of thumb.
. You should, in the conclusions, report on the limitations of the data you have used or on what future studies of the same topic might need to look for.
. You should label/number figures and tables fully and appropriately. A general rule of thumb is that a figures and diagrams should be understandable on their own without having to refer to the main text. Figures should be referred to them in the main text by “Figure n” or “Table n” where n is the number of the table or figure in the sequence through the paper. Note that the words “Table” and “Figure” have a capital first letter (as “Table 1” is a pronoun).
. Any plagiarism from source/reference material or other group's work will be penalised and may result in a mark of zero (please refer to your programme handbook).
. You must submit your coursework report for this course to Blackboard by the deadline. An indicative breakdown of marks is listed in the following table
Assessed report %
Introduction 15
Methodology (major data pre-processing tasks) 35
Results (description, discussion, analysis, etc.) 25
Conclusion, implications and recommendation 15
Layout and presentation 10
2024-02-17