MSc Introductory Module
Hello, dear friend, you can consult us at any time if you have any questions, add WeChat: daixieit
Laboratory Assignment
MSc Introductory Module (Part I)
Assignment Instructions
You should work in groups of 4 persons. You may decide the group membership by yourself – the deadline for this is 6 Oct. After that date, I will allocate persons to groups (or join groups) which do not have 4 members.
EACH GROUP should record the outcomes of their work in ONE lab-report and store any required program code and files.
Tha lab-assignment report can be written in LaTeX or MS Word. The report should be written using font size of 11pt. Matlab code listings should be included in appendices of the report and should be of 9pt font size.
The front page of the report should contain the module title and IDs of all persons working in the group. It should indicate the overall effort of each person as agreed by the group. The total group effort should sum up to 100%. If all persons worked equally, the effort of each in a group of 4 persons would be 25%. There should be also a clear indication to which parts of the assignment each person contributed to.
Submission of the assignment (as well as all the required files) is through Canvas – under the ‘MSc Introductory Module for Computer Engineering’, find the assignment ‘Lab-Assignment Submission’. The report should be submitted in .pdf file format. Make sure you attach all the files required and make your submission. EACH GROUP should make a SINGLE SUBMISSION.
The usual penalty of 5% per day will apply to all late submissions.
Plagiarism
Plagiarism will not be tolerated. It is the act of a Student claiming as their own, intentionally or by omission, work which was not done by that Student. Plagiarism also includes a Student deliberately claiming to have done work submitted by the Student for assessment which was never undertaken by that Student, including self-plagiarism and the other breaches. Sanctions of a plagiarism include the Student failing the Programme of study.
1 Introduction
This assignment will test your knowledge and understanding of the following topics: programming in Matlab (loops, vectors, matrices, functions, reading/writing to files), discrete Fourier transform, digital filtering, modelling of data using Gaussian probability density function (PDF). This will be done through analysis of a given set of audio data.
2 Data
Data you will use consists of audio data and accompanying text data (referred to as labels). The data is part of the TIMIT dataset1 , which has been used widely for research in speech processing. You will use 50 files (audio and text), which are arranged in sub-folders.
The audio data contain recordings of speech, sampled at 8 kHz sampling frequency. The files are in Microsoft ‘.wav’ format, which can be read in Matlab using the function ‘audioread’.
Each audio wav-file is accompanied with a text file, referred to as label file (.lab file). Each .lab label file contains three columns – the third column is the list of phonemes (i.e., types of speech sounds) that are spoken in the corresponding wav-file; the first and second column give the start and end times of each phoneme, respectively. The times are in 100 ns (i.e., 1409375 corresponds to 140.9375 ms). An example of the label file is given in Figure 1.

Figure 1: A part from the label file corresponding to the audio ‘MCPM0/SA1.wav’.
You are also given a text file ‘listData.txt’ that contains the list of all the filenames (without the file extension) of the data.
3 Assignment task
Your Matlab program should be a text-based menu-driven program that has the following options for user to choose by pressing the speciffied letter (‘a’, ‘b’, ‘c’, ‘d’, or ‘e’):
(a) Perform FIR filtering
(b) Extract signal segments
(c) Calculate energy for specified frequency regions
(d) Modelling of energy values using Gaussian PDF
(e) Exit the program
The definition of all of these options is given in the following subsections.
3.1 Option (a): Perform FIR filtering
This option should read the text file ‘listData.txt’ and then in a loop load one by one the original wav-files from folder ‘wavOrig’, perform filtering on each file and store the output signals into wav-files with the same name but into a new folder named ‘wavFilt’. The new created wav-files should be of the same length as the original wav-files.
Your program should implement FIR filtering of the audio signal through the relation between the output y(n) and input x(n) signal sample values. The first output signal value y(1) should correspond to the first input signal value x(1) and you should assume that values of the input signal samples x(n) for time n ≤ 0 are zero. The filter is defined by its impulse response h(n) given in Eq. 1.

Your program should also produce a figure of the magnitude frequency characteristic of the filter.
You should not use Matlab functions such as ‘dir’ to read the content of a folder – you are asked specifically to read the text file ‘listData.txt’ and work from there. You are also not allowed to use any Matlab ready-made functions to perform the filtering and obtain the filter frequency characteristic (such as, ‘filter’, ‘conv’, ‘freqz’).
Deliverables:
● Include in the report: Figure of the magnitude frequency characteristic of the filter.
● Attach to your submission: A zip file of the folder ‘wavFilt’, containing all your created wav-files.
3.2 Option (b): Extraction of signal segments
This option should extract from the audio wav-files a specified part of the signal corresponding to the phoneme ‘iy’ and phoneme ‘s’ and store the extracted signals into matrices.
For each wav-file, you will need to read the corresponding label file and find all the occurrences of the the phonemes ‘iy’ and ‘s’. For a given occurrence of the phoneme, you should extract from the wav-file a segment of 20 ms of the signal around the centre of the phoneme, i.e., the start time (denoted by timeSegStart) and the end time (denoted by timeSegEnd) of the segment to be extracted shoud be calculated in miliseconds as:

where timeP hStart and timeP hEnd are, respectively, the start and the end times of the phoneme, as found in the label file but converted to miliseconds.
The 20 ms signal segments of the phoneme ‘iy’ and phoneme ‘s’ should be extracted from all the files and separately from ‘wavOrig’ data and ‘wavFilt’ data and stored into arrays named: segOrig_phIY, segFilt_phIY, segOrig_phS and segFilt_phS. Each of these arrays should be of the size num×nSamples, where num is the number of occurrences of the particular phoneme (‘iy’ or ‘s’) and nSamples is the number of samples in the 20 ms segment of signal, i.e., each row in the arrays corresponds to phoneme occurrence and each column to the sample index. After processing all files, store the arrays into a mat-file called ‘segAllData.mat’. Note that the number of occurrences of these phonemes in each file varies (and sometimes there is none).
Deliverables:
● Include in the report: Figures of the extracted 20 ms signal segment of the phoneme ‘iy’ and phoneme ‘s’ from the file ‘MDPK0/SA1.wav’ for each conditions (‘wavOrig’ and ‘wavFilt’). Figures of the magnitude spectrum of these extracted segments.
● Attach to your submission: The mat-file ‘segAllData.mat’, containing the arrays: segOrig_phIY, segFilt_phIY, segOrig_phS and segFilt_phS.
3.3 Option (c): Calculate average energy for specified frequency regions
This option should for each signal segment (extracted under Option (b)) calculate the magnitude spectrum (i.e., apply DFT and then absolute value) and then calculate the average energy for frequency region A defined as 0.4 − 1.6 kHz and frequency region B defined as 2.4 − 4 kHz. That means, the average energy (denoted as aveEn) for a given frequency region should be calculated as:
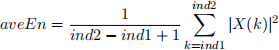
where X(k) is the value of the spectrum at the frequency index k, and the frequency indices ind1 to ind2 are integer indices corresponding to the low cut-off and high cut-off frequency of the region (e.g., 0.4 kHz and 1.6 kHz, respectively, for the region A). These average energies should then be converted to decibels (dB), i.e., perform 10 ∗ log10(aveEn).
For each phoneme (‘iy’ and ‘s’), process all the signal segments from data conditions ‘orig’ (as extracted under Option (b) and stored in the arrays segOrig_phIY and segOrig_phS), and store the calculated energy values (in dB) in 2D arrays, named accordingly: enRegAB_orig_phIY and enRegAB_orig_phS. Each of these arrays should be of size num×2, where num is the number of occurrences of the particular phoneme (‘iy’ or ‘s’) across all files, i.e., each row in the arrays corresponds to a phoneme occurrence and each column to the energy values for the region A and B.
Deliverables:
Include in the report:
● Histograms of the average energy values for the frequency regions A and B for the phoneme ‘iy’ and ‘s’ in condition ‘orig’, i.e., histograms of data in variables: enRegAB_orig_phIY and enRegAB_orig_phS.
3.4 Option (d): Modelling of energy values using Gaussian PDFs
This option should perform modelling of the energy values (in dB), as obtained in Option (c), separately for each frequency region A and B for each phoneme (‘iy’ and ‘s’) for condition ‘orig’ using Gaussian PDFs.
Deliverables:
Include in the report (for each phoneme):
● A table with the values of the parameters of the Gaussian PDFs modelling each data.
● Discuss the appropriateness of modelling using Gaussian PDFs.
3.5 Option (e): Exit the program
This option should exit the program.
4 Report and Marking criteria
Attach with your submission: report, files as requested in each of the tasks, .zip file containg all your m-files. Also include listing of your program in appendices section of your report.
Marking will be according to the following criteria:
● Correctness of operation and completeness of part (a) [ 15 points ]
● Correctness of operation and completeness of part (b) [ 20 points ]
● Correctness of operation and completeness of part (c) [ 20 points ]
● Correctness of operation and completeness of part (d) [ 15 points ]
● Matlab programming – demonstration of suitable use of programming concepts and code efficiency [ 15 points ]
● Quality of report – formatting, English, figures with labels, etc [ 15 points ]
2021-10-23