EC404 MACROECONOMICS MRes MID-TERM TEST 2023-24
Hello, dear friend, you can consult us at any time if you have any questions, add WeChat: daixieit
MID-TERM TEST 2023-24
EC404 MACROECONOMICS MRes
1. Answer all parts of this question.
Consider the continuous-time neoclassic growth model discussed in the lectures, with ex- ogenous technological growth rate g and population growth rate n. Utility function is log: u(C) = log C and production function is Cobb-Douglas: F (K, L) = Kα (AL)1−α .
(a) [10 marks] Write down the household’s maximization problem, where households choose consumption C and assets a, taking interest rate rand wage per household W as given. (No need to show how you normalize c using A). Set up the Hamiltonian and derive the dynamic equations for C and a, taking rand W as given.
(b) [10 marks] Substitute r and W as functions of capital per unit of effective labor k = K/(AL). Derive the dynamic equations of normalized variables k and consumption c.
(c) [10 marks] Solve for the steady state level of k and c. Plot the phase diagram to show how balanced-growth-path levels of k and c, denoted as k* and c* , are determined, and how k and c converge to k* and c* , if the economy starts from a low initial capital k0 > k* .
(d) [10 marks] Suppose that at time 0, k0 < k* , and an unexpected shock hits the econ- omy: Technological level jumps up while afterwards technology growth rate g stays unchanged. How does the long-run level of k change, compared to level k* without this shock? How does the dynamics of k change, compared to the dynamics of k without this shock? Explain your answers.
2. Answer all parts of this question.
Consider the OLG economy discussed in the lectures without exogenous technological growth (g = 0). Let n denote the rate of population growth. Households’ utility function is CRRA: u(C) = C1−σ /(1 − σ). Households maximise
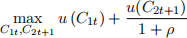
subject to
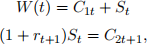
where St denotes savings, ρ > 0 is the discount rate, and rt+1 the real rate of return on savings. The production function is Cobb-Douglas such that Yt = Kt(α)Lt(1)−α , where α denotes the capital share in output. Depreciation rate is δ .
(a) [10 marks] Derive the Euler equation of the households in this economy (remember to use the CRRA utility function). Explain intuitively your answer. Explain how r, ρ and σ affect consumption growth.
(b) [10 marks] How do savings St respond to changes in the interest rate rt+1, if σ > 1? Explain intuitively your answer.
(c) [10 marks] Assume that the utility function becomes logarithmic (σ = 1) for this sub- question and all subquestions below. Derive the law of motion for capital per worker kt+1 as a function of kt. Use phase diagram to illustrate the dynamics of kt given a low level of initial capital per worker k0 < k* , where k* denotes the steady state level of capital per worker.
(d) [10 marks] Suppose that the economy is at the steady state at period t0 − 1. Unexpectedly, in the beginning of period t0 , the depreciation rate δ jumps up to δ′ > δ and stays at the new level forever. How do kt and Kt respond after t0 and in the long run? Explain your answers.
(e) [10 marks] Let us introduce two types of households, in this subquestion and the next subquestion. Suppose that these two types of households differ in time discount factor ρ: discount factor for H type is ρH and for L type if ρL < ρH . Population sizes of H and L types are Nt(H) and Nt(L) = Nt − Nt(H), which grow at the same rate n. Both types of households supply labor when they are young, and reply on the savings when they are old. Aggregate capital is the sum of both types of households’ savings. Derive the law of motion for capital per worker kt+1 .
(f) [10 marks] What is the steady state level of capital k? What is the wealth inequality be- tween the two types of households, measured by SL/SH , i.e., savings of an L household over savings of an H household. How does this wealth inequality depend on population share of H type,i.e., NH/N? Explain your answers.
2024-01-29