GGR201 Geomorphology Lab 1 – Topography and Using Google Earth Winter 2024
Hello, dear friend, you can consult us at any time if you have any questions, add WeChat: daixieit
GGR201 Geomorphology
Winter 2024
Lab 1 - Topography and Using Google Earth (10%)
Due online by January 22, 2024, by 11:59 pm (ET)
Introduction
A fundamental component of understanding landscapes involves characterizing the size, shape, orientation, and location of relevant landforms.
While some direct measurements can be made in the field, individual landforms may be too large to conveniently measure or too remote to access easily. As a result, geomorphic interpretations often rely on maps, aerial photographs, satellite imagery, and other forms of remote sensing.
For this assignment, you will use topographic data, geological data, and Google Earth to investigate and describe landscapes and landforms in North America.
Background Information and Resources
Topographic maps represent the topography (the arrangement and relief of physical features) of an area. These maps are useful because they not only display geographic coordinates and elevation data (Figure 1) but often contain information on landforms, hydrology, vegetation, and human modifications of the landscape.
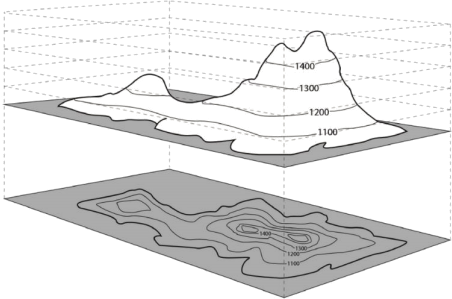
Figure 1 - Schematic drawing of how topographic map contour lines (lines connecting points of equal elevation) reflect real-world topography (Cage,n.d.)
Instructions for Lab Exercises
• Review the GGR201 – Practical/Lab Information Sheet.
• Your answers should be clear and comprehensive. They can be submitted as point form.
• If calculations or values are required as part of your answer, show your work for the solution, including all correct units, to receive full marks.
• Use screenshots, photos, maps, etc. to support your answers. All figures and tables must be referred to in the text, have an informative caption, and have relevant source information.
• Provide citations for any information referenced from an external source (e.g., lectures, textbook, journal articles, government reports, etc.) in APA style (7th Ed.)
o In-text citation example: (Peirce, 2024) or Peirce (2024)
o Reference list examples for the textbook and lecture slides:
Bierman, P. R. & Montgomery, D. R. (2020). Key Concepts in Geomorphology (2nd ed.).
MacMillan Learning.
Peirce, S. (2024, January 8). GGR201 - 1- Geomorphology [Powerpoint Slides]. Quercus.
• You may collaborate with other students during lab time, but each student is expected to submit their own individual assignment in their own words.
• The use of generative AI tools or apps to create content for this assignment is prohibited.
• Submit your assignment on Quercus as a .docxor PDF.
Tips for Using Google Earth
This course uses Google Earth. You can download a free copy of Google Earth Proto your own computerhere. The “Pro” version has more tools and capabilities than the online version and that is what is recommended for this course.
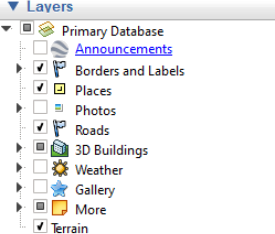
Figure 2 - Screenshot of Layers menu in Google Earth Pro (Source: Google LLC, 2022)
• Check that the “Terrain” layer is selected when working on labs for this course (Figure 2).
o You may want to disable the 3D buildings, Weather, Gallery, and More layers for optimal viewing.
• You can change the vertical exaggerate value of the terrain (between 0.01 and 3). While the default is 1, when set to 3 the vertical distances will appear 3x bigger than in real life. This can be a helpful tool for seeing details, but it can also cause distortion.
o On a PC: Tools > Options > 3D View from the Tools figure
o On a Mac: Google Earth > Preferences > 3D View
• Coordinates refer to number used to locate a specific point in space. In geography, we often use latitude and longitude. In Google Earth, you can see the coordinates for the location of your cursor in the bottom banner (Figure 3).
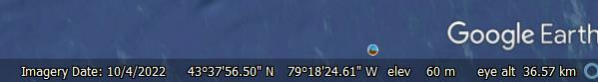
Figure 3- Example of the bottom banner of Googe Earth Pro showing the imagery date, coordinates (lat/long shown here),the elevation (elev), and eye altitude. (Source: Google LLC, 2022)
o You can change the format coordinates are displayed in:
. On a PC: Tools > Options > 3D View > Show lat/long
. On a Mac: Google Earth > Preferences > 3D View > Show Lat/Long
Part I - Topography and Geology of Southern Ontario (28 Marks)
Visit the Government of Canada interactive map –The Atlas of Canada - Toporama(Legend). Using Toporama, answer the following questions.
1. What is the latitude and longitude of Crawford Lake (center), Halton, Ontario? (2 marks)
Zoom out to investigate the area around Crawford Lake, including the Nassagaweya Canyon and Rattlesnake Point Conservation area.
2. What is the name of the creek flowing through Nassagaweya Canyon? Which direction is it flowing? How do you know? (2 marks)
3. Describe the topography and landscape features of the area between Rattlesnake Point Conservation Area and Crawford Lake. In your answer, describe changes in elevation, the spacing of contour lines, as well as features such as rivers, woods, etc. (4 marks)
Launch Google Earth Pro. Navigate to Crawford Lake using the latitude and longitude you determined above. The Google Earth ruler (Figure 4) allows you to measure the distance along a line, path, polygon, and circle. Use the ruler tool to answer the next question.

Figure 4 - Google Earth tools, with the ruler outlined with a red box.
4. Using the ‘polygon’ option of the ruler tool, estimate the perimeter and area of Crawford Lake in kilometers and square kilometers, respectively. (2 marks)
The Google Earth Path tool allows you to make a new layer (Figure 5).

Figure 5 - Google Earth tools, with the Path tool outlined with a red box.
5. Using the Path tool, draw a straight line between the center of Crawford Lake and the Appleby line Entrance to Rattlesnake Point Conservation Area (Latitude: 43°28’19” N, Longitude: 79°54’42” W). Navigate to the ‘measurements’ tab and record the length of your path in kilometers (1 mark)
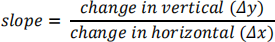
6. Right click on your new path layer and select ‘Show elevation profile’. Based on your elevation profile, what is the minimum, maximum, and average elevation along your path (1 mark)? What is the approximate slope from the top of Nassagaweya Canyon to the valley bottom along the westside (2 marks)? Here is the equation for slope:
7. Include a screenshot of your map with your new path and elevation profile (1 mark). Review assignment expectations on including figures in your work.
While surficial geology maps are not landform maps in the way topographic maps are, they provide information on the composition of the land surface materials. In addition, mapped materials are generally in chronological order from the oldest formed/deposited material (smallest number) to the most recent (largest number) which can be helpful for analysis and characterization of landforms.
• Go to the Government of Ontario website:https://data.ontario.ca/dataset/surficial- geology-of-southern-ontario.
o Click “ Explore” beside the KML file “Surficial geology of Southern Ontario” and click on the URL at the top of the page to download it.
o Save the file to your computer.
o Open Google Earth Pro and under “File → Open” navigate to your saved file.
o Once open in Google Earth Pro, click ‘View Legend’ under the data layer, which will open a detailed map legend in a new window. The legend file is also available on Quercus.
8. What surficial geology materials exist along your path from Crawford Lake to Rattlesnake Point Conservation Area? (2 marks)
9. Based on the legend, which of the surficial materials are the oldest? (1 mark)
10. Based on course content, how does knowing the geology of an area, like Rattlesnake Point, help us better understand the history and evolution of the landscape? (3 marks)
11. Map unit 5 is a dominant material covering much of the area between Rattlesnake Point Conservation Area and the shores of Lake Ontario. What is the material? What process(es) may have been responsible for depositing this material? (3 marks)
12. Crawford Lake is a site of geological significance. Using reliable resources, briefly summarize the significance of Crawford Lake. Remember to include in-text citations and a reference list. (4 marks).
Part II - Grand Canyon, Arizona (14 marks)
• Download the Google Earth Grand Canyon.kmz file from Quercus.
o Once downloaded, double click on the file (or open it in Google Earth under menu File > Open) to add it to your Temporary Places directory in your My Places sidebar panel.
o To save it permanently in Google Earth, right click on the folder and select “Save to My Places” .
• In Google Earth, expand the Grand Canyon maps folder and click on the Grand Canyon Village Topographic Map overlay.
• In the sidebar (My Places) you will see a shaded box icon at the bottom of the box. Click this icon and a slider bar appears (seeFigure 6“Adjust Opacity”).
o Set the opacity of the topographic map at about halfway along the slider scale. This will allow you to see the actual land surface beneath the map.
o As you work through the questions below, you will want to return to this slider to change the opacity to suit your needs.
• For optimum viewing use Google Earth
o Tools ![]() Options
Options ![]() 3D View (tab)
3D View (tab) ![]() Terrain
Terrain ![]() Elevation Exaggeration (box)
Elevation Exaggeration (box) ![]() set to 0.75
set to 0.75
o Tools ![]() Options
Options ![]() 3D View (tab)
3D View (tab) ![]() Units of Measurements (box)
Units of Measurements (box) ![]() check Meters, Km
check Meters, Km
• You should see something that looks like Figure 6.
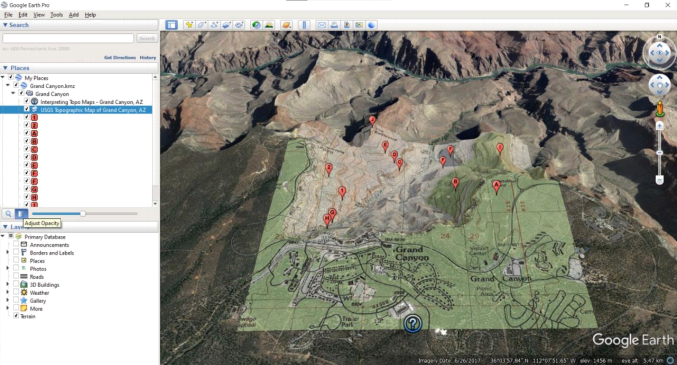
Figure 6 - Screenshot of Google Earth with recommended settings for this lab assignment.
13. Looking between the two F place markers, describe the shape and orientation of the contour lines when a creek crosses them. (1 mark)
14. Double click the icon for placemark G and notice that placemarks G and H lie along the Bright Angel Trail (the dotted line on the map and Google Earth when “Roads” layer turned on). Determine the slope between the G and H placemarks (step-by-step details below). (4 marks)
• Using the Status Bar at the bottom right of the display, determine the elevation (in m) of placemark G and placemark H . Calculate the change in elevation (Δy) from G to H = ma.s.l. (above sea level).
• Use the Ruler tool in Path mode to measure the distance (in metres) along Bright Angel Trail between G and H following the dashed line.
• Calculate the slope from G to H along the Bright Angel Trail.
• Compare the slope from G to H along the Bright Angel Trail with the slope you get along the straight-line distance between the two points (i.e., not along the trail).
15. The topographic map overlay is coloured green at the surface around placemarks I and B. In contrast, all the placemarks on the opposite side of Garden Creek are not coloured. Explain what the green colour represents and the factors that might explain the difference on the opposite sides of the valley. (3 marks)
16. Double click the "? Interpreting Topo Maps – Grand Canyon, AZ" icon in the sidebar to re-center your view. How has the area covered by the map changed compared to the imagery in Google Earth now? (2 marks)
17. While the exact age and evolution of the Grand Canyon is debated, use reliable sources and your observations to describe both the general physical characteristics and the main geomorphic processes responsible for the Grand Canyon. (4 marks).
References
Cage, C (2020) Contour lines and Topo Maps.https://www.greenbelly.co/pages/contour-lines. GreenBelly. Retrieved April 25, 2021.
Google LLC. (2022). [Screenshots of Google Earth Pro features]. In Google Earth Pro (7.3.6.9345) [Computer software].https://www.google.com/intl/us/earth/versions/#earth-pro
Acknowledgements
This assignment has been adapted from work done by Dr. J. Desloges (University of Toronto) and Dr. Elli Papangelakis (McMaster) with permission.
2024-01-23