CENV6153 TRANSPORT MODELLING SEMESTER 1 ASSESSMENT PAPER 2020/21
Hello, dear friend, you can consult us at any time if you have any questions, add WeChat: daixieit
SEMESTER 1 ASSESSMENT PAPER 2020/21
CENV6153
TRANSPORT MODELLING
Question 1
a) The developers of a small residential development on the outskirts of an existing town have been asked to estimate the daily trip levels it will produce.
A survey of households within the existing town (Table 1) has identified their total numbers of current trips productions (Table 2), with households recorded by number of adults and annual disposable income.
If the new development is expected to contain three households in each of the 15 socio-economic groups in Tables 1 and 2, show that the total number of trip productions for the new zone is expected to be 212. [10 marks]
|
Income |
1 Adult |
2 Adults |
3+ Adults |
|
< £20,000 |
11 |
20 |
10 |
|
£20-30,000 |
20 |
20 |
8 |
|
£30-40,000 |
11 |
21 |
7 |
|
£40-50,000 |
17 |
16 |
24 |
|
> £50,000 |
19 |
8 |
22 |
Table 1. Number of households taking part in the survey
|
Income |
1 Adult |
2 Adults |
3+ Adults |
|
< £20,000 |
39 |
80 |
42 |
|
£20-30,000 |
74 |
83 |
38 |
|
£30-40,000 |
51 |
104 |
33 |
|
£40-50,000 |
81 |
82 |
133 |
|
> £50,000 |
99 |
40 |
137 |
Table 2. Total trip productions recorded in the survey
b) An existing trip productions and attractions matrix for the town is given in Table 3. If the productions for the new residential
development can be added to zone Homes-3 (with ¼ of the new productions added to total attractions for each of the four zones), Use the Furness Method to estimate the new trip matrix for the town.
You may accept a maximum error in any total production or total attraction value of 0.5%. [10 marks]
|
Zone |
Attractions |
||||
|
Homes-1 |
Homes-2 |
Homes-3 |
Shops- 1 |
||
|
|
146 |
97 |
60 |
283 |
|
|
duc |
Homes-2 |
120 |
117 |
130 |
224 |
|
|
119 95 |
94 56 |
129 55 |
271 145 |
|
Table 3. Existing productions-attractions levels
c) Explain why it is important to feed the results from the final stage of a 4-stage model back to the earlier stages. [5 marks]
Question 2
a) Explain the difference between fully joint tours and partial joint tours in Activity Based Models. Give an example of (and illustrate) each type of joint tour. [5 marks]
What a day! It all started off as normal, I drove our two children (Nyla and Maison) to school on my way to the office while my wife (Alyssia) walked to her elderly father’s house to spend the day with him. I was just starting my first meeting after lunch when I got a text message from Alyssia that her father had fallen over and hurt his leg … could I come and take him to the doctors? I left my meeting (as quickly as possible) and drove to his house (stopping off at the petrol station to fill up my car on the way).
When I arrived (fortunately it did not look too serious an injury), Alyssia reminded me that Nyla had a trumpet lesson after school today. I said she had forgotten to take her trumpet with her this morning, so Alyssia went home to get it while I took her father to the doctors.
At the end of the school day Alyssia gave the trumpet to Nyla so she could have her music lesson (they use one of the classrooms at the school which is good). Because I was still at the doctors,
instead of walking home with Maison (and leaving me to pick up
Nyla at the end of her lesson as I usually would) Alyssia and
Maison played in the park near to the school for 30 minutes instead.
Just before they left the park to walk back to the school and pick up Nyla at the end of her lesson, I arrived so they got into the car. We picked Nyla up, took Alyssia’s father back home, and then went to the cinema to watch the new Star Wars film we had been wanting to see all week. We are back home now, and the children are both
asleep. I wonder what happened in my meeting.
Draw a diagram to illustrate the complete joint tours of every person and all locations mentioned in the story above. [10 marks]
c) The transport system can be considered to be a merger of demand, supply and behaviour effects.
Provide five examples of changes to the transport system and explain for each example which type of effect it is and how it can be represented within the four stage model (or why the four stage model cannot represent it). [10 marks]
Question 3
During the summer months a large number of tourists visit a seaside town, using either the 4.5km coast road or the 5.5km town centre route to get to the beach car-park. This causes substantial congestion and poor air quality within the town centre and therefore the construction of a new 6.5km bypass road has been proposed.
The measured speed-flow curves for the two existing routes and the expected speed-flow curve for the bypass route are shown in Figure 1.
You may assume that the perceived cost of a route is equal to its travel time
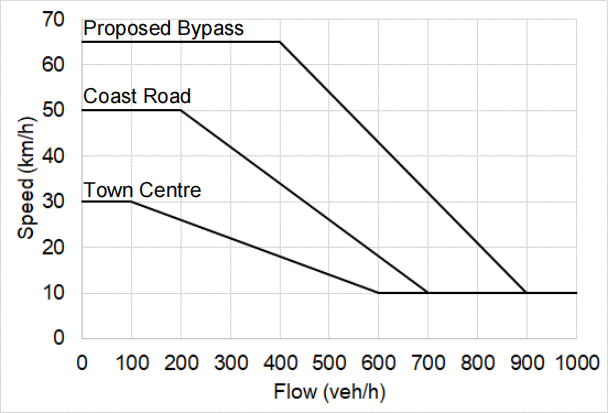
Figure 1. Speed-flow curves for the three routes
a) Before the bypass is constructed, if the total flow of vehicles is 1000 veh/h calculate the equilibrium flow on each route. [10 marks]
b) If the proposed bypass route is 6.5km, use five iterations of the
Method of Successive Averages approach to predict the flows on the three routes when the bypass is opened. Explain the reason for the predicted flow level on the town centre route. [10 marks]
c) Explain why the route choices of tourists may not be the same as the route choices of local residents. [5 marks]
Question 4
A student has been invited to a job interview starting at 09:30 in the city centre and prefers to arrive at the location between 09:00 and 09:20. Physical attendance is required (this is not an online interview!) and if the student is late for the interview they will not get the job.
To get to the interview they intend to travel by bus (Route X1). All X1 buses travel direct from the same stop to the location of the interview, but due to congestion in the morning peak period the travel time depends on the departure time as given in Table 4.
|
Departure Time |
Travel Time (minutes) |
|
08:00 |
15 |
|
08:15 |
19 |
|
08:30 |
23 |
|
08:45 |
27 |
|
09:00 |
23 |
|
09:15 |
19 |
|
09:30 |
15 |
Table 4. Bus departure and travel times
The student’s utility of an arrival time A is given by
UA = 12.7 – 0.3T – 0.1E – 0.2L
where
T is the travel Time (in minutes) to arrive at time A
E (and L) are the number of minutes that A is Earlier (and Later) than their preferred arrival time window
Which bus should the student choose to get to the job interview? [10 marks]
b) 50 students have the same choice as in part (a). Use a logit model to predict how many who would choose the 08:00 X1 bus. [5 marks]
c) Explain how your methodology of answering part (b) would change if there were two bus routes available to the student (X1 and Y2) which left from different stops that were different walking distances from the student’s house. [10 marks]
2024-01-19