MAST 20005 Statistics Summer 2024 Assignment 1
Hello, dear friend, you can consult us at any time if you have any questions, add WeChat: daixieit
MAST 20005 Statistics Summer 2024
Assignment 1
Due: 11 pm, Thursday 18 January 2024
Instructions: See the LMS for the full instructions, including the submission policy and how to submit your assignment. Remember to submit early and often: multiple submission are allowed, we will only mark your inal one. Late submissions will receive zero marks.
Questions labelled with‘(R)’require use of R. Please provide appropriate R commands and their output, along with sufficient explanation and interpretation of the output to demon- strate your understanding. Such R output should be presented in an integrated form together with your explanations. All other questions should be completed with- out reference to any R commands or output, except for looking up quantiles of distributions where necessary. Make sure you give enough explanation so your tutor can follow your rea- soning if you happen to make a mistake. Please also try to be as succinct as possible. Each assignment will include marks for good presentation.
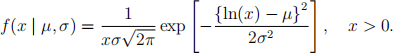
1. Let X1 , . . . , Xn be a random sample from the Log-normal distribution, LN(μ, σ), whose pdf is:
(a) Show that

Hint: you may use the fact that if Z N (0, 1), then X = exp(μ+σZ) LN(μ, σ). Also, the moment generating function (MGF) of a normal random variable may be useful here.
(b) Show that the method of moments estimator (MME) of μ and σ are
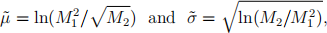
where  are the irst two sample mo-ments.
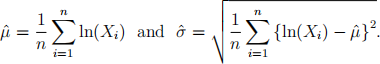
(c) Show that the maximum likelihood estimator (MLE) of μ and σ are
(d) Find the expectation of 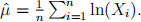 Is ˆ(μ) an unbiased estimator of μ?
(e) Assume σ2 = 1. Find the Rao-Cram,er lower bound for μ .
2. (R) Let X be a random variable representing the number of new COVID-19 cases reported in Victoria. The following are 16 observations of X (from December 25, 2021 to January 9, 2022):
2108, 1608, 1999, 2738, 3767, 5137, 5919, 7442,
7172, 8577, 14020, 17636, 21997, 21728, 51356, 44155
(a) Give basic summary statistics for these data and produce a box plot. Briely comment on center, spread and shape of the distribution.
(b) Assuming a Log-normal distribution (LN(μ, σ) as in Question 1), compute maxi- mum likelihood estimates for the parameters.
(c) Draw a density histogram and superimpose a pdf for a Log-normal distribution using the estimated parameters.
(d) Draw a QQ plot to compare the data against the itted Log-normal distribution. Include a reference line. Comment on the it of the model to the data. Hint: Quan- tile for the Log-normal distribution may be computed using the qlnorm function in R.
3. Let X1 , . . . , Xn be a random sample from a discrete distribution with the following pmf:
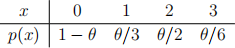
(a) (i) Find E(X1 ) and var(X1 ).
(ii) Find the method of moments estimator (MME) θ(˜) of θ .
(iii) Is θ(˜) unbiased for θ? Explain why or why not.
(iv) Find the variance ofθ(˜).
(b) Let F0 , F1 , F2 and F3 denote the sample frequencies of 0, 1, 2 and 3, respectively. That is, Fk =Σ![]() I(Xi = k) for k = 0, 1, 2, 3.
I(Xi = k) for k = 0, 1, 2, 3.
(i) Find the likelihood function in terms of F0 , F1 , F2 and F3 . (ii) Show that the maximum likelihood estimator (MLE) of θ is
![]() θ = 1 - F0 /n.
θ = 1 - F0 /n.
Hint: use the fact that F0 + F1 + F2 + F3 = n.
(iii) Find the sampling distribution of F0 .
(iv) Is θ(ˆ) unbiased for θ? Explain why or why not.
(v) Find the variance ofθ(ˆ).
(vi) Find an approximate 95% conidence interval for θ based on θ(ˆ).
4. Let X have a Pareto distribution with pdf,
f(x) = θx-(θ+1), x > 1, θ > 0.
Suppose we have a random sample of n observations X1 , . . . , Xn on X .
(a) Find the cdf of the sample minimum, X(1) .
(b) Find the p quantile, πp , of X .
(c) Find the asymptotic variance of the sample median, M(ˆ) .
5. Ethan wants to know how long (in minutes) it takes to walk from the State Library to the Peter Hall Building. Over the past ten days, Ethan records the time (in minutes) needed for him to inish the trip, as follows:
16.8 12.5 17.2 14.1 14.5 13.2 15.6 14.6 14.8 13.6
Assuming a normal distribution N(μX , σX(2)) for these observations, please answer the following:
(a) If σX(2) is unknown, calculate a 95% conidence interval for the mean μX . (b) Find a 90% conidence interval for σX(2) .
(c) Assume σX = 2 minutes and that you want a 95% conidence interval of width 2 (i.e. 1). How many experiments are needed?
Zoe also has a record of the time for her to walk from the State Library to the Peter Hall Building, as follows:
20.3 23.0 19.4 15.3 20.0 20.3 21.6 19.6
Assuming a normal distribution N(μY , σY(2)) for these observations, please answer the following:
(d) Calculate a 95% conidence interval for μX - μY by assuming that σX(2) = σY(2) . (e) Calculate a 95% conidence interval for μX - μY by assuming that σX(2) ![]() σY(2) .
σY(2) .
(f) Calculate a 95% conidence interval for σX(2)/σY(2) .
(g) (R) Calculate a 95% conidence interval for σX(2)/σY(2), using the R function var. test().
6. Twenty-four 9th- and 10th-grade high school girls were put on an ultraheavy rope- jumping program. The following data give the time diference for each girl (“before program time” minus “after program time”) for the 40-yard dash:
0.28 0.01 0.13 0.33 -0.03 0.07 -0.18 -0.14 -0.33 0.01 0.22 0.29
-0.08 0.23 0.08 0.04 -0.30 -0.08 0.09 0.70 0.33 -0.34 0.50 0.06
Find a one-sided 95% conidence interval that is a lower bound for μD , the mean of the diference in race times.
7. In November 05, 2021, Pizer Inc. announced its investigational novel COVID-19 oral antiviral candidate, PAXLOVID™ , signiicantly reduced hospitalization and death, based on an interim analysis of the Phase 2/3 EPIC-HR (Evaluation of Protease Inhibition for COVID-19 in High-Risk Patients) randomized, double-blind study of non-hospitalized adult patients with COVID-19, who are at high risk of progressing to severe illness.
In one of their experiments, there were two groups of patients treated within ive days of symptom onset: the treatment group who received PAXLOVID™ , and the control group who received a placebo. For the patients in the treatment group who received PAXLOVID™ , only 6 out of 607 patients were hospitalized. For the patients in the control group who received a placebo, 41 out of 612 patients were hospitalized.
Let p1 be the proportion of patients that will be hospitalized after receiving PAXLOVID™ , and let p2 equal the proportion of patients that will be hospitalized after receiving a placebo.
(a) Give a point estimate of p1 .
(b) Find an approximate 95% conidence interval for p1 .
(c) Find an approximate 99% conidence interval for p1 - p2 .
2024-01-18