CENG0025 Coursework 2
Hello, dear friend, you can consult us at any time if you have any questions, add WeChat: daixieit
CENG0025 Coursework 2
Summary
This report will provide an in-depth analysis of a distillation column through gPROMS dynamic simulation, revealing how variations in operating parameters such as reflux ratio, vapour flow rate and temperature can significantly affect the performance of a distillation column. Key findings include that increasing the reflux ratio increases the vapour mole fraction of benzene, while increasing the vapour flow rate to the reboiler has the opposite effect. Changes in operating temperature have a significant effect on the vapour mole fraction of benzene, whereas changes in pressure do not.
Mathematic model equations for a single tray and a column
Assumption:
1. No dynamics in the downcomer, no weeping or flooding and no entrainment.
2. No reaction takes place.
3. Perfect mixing.
4. Vapour holdup is negligible.
5. Thermodynamic equilibrium (Murphree efficiency = 1).
6. Linear tray hydraulics.
7. No energy balances.
8. Constant pressure.
9. The heat of mixing is zero.
10. Equimolar overflow.
11. The properties of the mixture are independent of temperature.
12. No pressure and temperature drops along trays.
13. Total reboiler and total condenser.
For single tray,
Material balance for component i,

Total holdup for component i,

Total influxes and effluxes of tray,

Tray Hydraulics,
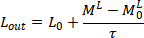
Vapour Liquid Equilibrium,
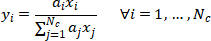
The constant relative volatility of components i with respect components j,
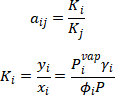
For whole column,
The connection between to tray could be present by,
Degree of freedom for one single tray
The constant relative volatility of components i with respect to components j and the equations will not present in the degree of freedom analysis because the variables in these equations will be provided from Multiflash using the foreign object interface, so ![]() will be treated as a parameter. Also, the flowrate with fractions of the feed stream and the parameter for Tray Hydraulics are provided in the question, they will not be present in the DOF analysis as well,
will be treated as a parameter. Also, the flowrate with fractions of the feed stream and the parameter for Tray Hydraulics are provided in the question, they will not be present in the DOF analysis as well,

Table 1. Equations and Variables for DOF analysis of tray
Then we could calculate the degree of freedom of single tray model,

Degree of freedom for whole column

Table.2 Equations for DOF analysis of column

Table.3 Variables for DOF analysis of column
Then we could calculate the degree of freedom of whole column model,
To eliminate the degree of freedom, 8 variables need to be assigned, which will be the flowrate from the reflux drum and reboiler,  and
and  , and the molar fraction of the stream,
  and
and  ,
,

The initial value for the total holdup of component I in each tray we used will be,

The value for the holdup is provided by the first few simulations, which is the value of molar holdup for each component at the first steady stage. In the model we built, the molar fraction will be larger than 1 if the initial molar holdup has a large difference from the steady state value, so this value allows the model to get to a steady state faster while giving a reasonable data.
The thermodynamic model we used in Multiflash will be Prefect Mixing for liquid and Ideal gas for gas.
Dynamic simulation results
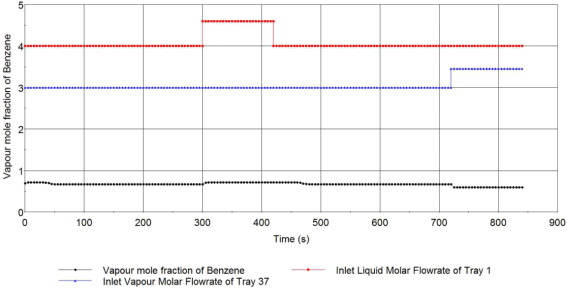
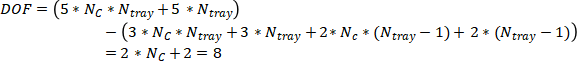
Figure.1 Vapour mole fraction of Benzene at the top of the column
From the change of the vapour mole fraction of Benzene at the top of the column, we find that it takes around 50 seconds to reach the steady state from the beginning. The vapour mole fraction of benzene is increased rapidly and stays steady when the reflux ratio is increased, after the reflux ratio is back to the initial value, it takes around 50 seconds to get back to the steady state. The vapour mole fraction of benzene is decreased rapidly and stays steady when the vapour flowrate from the reboiler is increased.
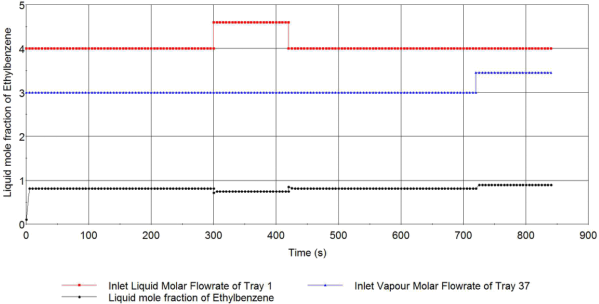
Figure.2 Liquid mole fraction of Ethylbenzene at the bottom of the column
From the change of the liquid mole fraction of Ethylbenzene at the top of the column, we find that it reached a steady state rapidly from the beginning. The liquid mole fraction of benzene is decreased rapidly with a small bounce and stays steady when the reflux ratio is increased, after the reflux ratio is back to the initial value, it is back to the steady state immediately with a bounce as well. The liquid mole fraction of benzene is increased rapidly and stays steady when the vapour flowrate from the reboiler is increased.

Figure.3 Vapour mole fraction of Benzene on each tray in the different state
The fraction of benzene on the top tray is highest at the greater reflux ratio state and lowest at the greater vapour flowrate state. For the trend of the curves, the fraction of the greater reflux ratio state is constant at the first 30 trays and decreases immediately at the last 7 trays, for two other states, it has similar trends, which decrease at the first 10 trays and keep constant at the last 27 trays.

Figure.4 Vapour mole fraction of Benzene at the top of the column at different operating temperature
In the figure.4, the vapour mole fraction of Benzene at the top of the column with 3 different operating temperatures is presented. The fraction of benzene is increasing along the temperature-decreasing and the response time of backing to the steady state is short as the temperature goes down.
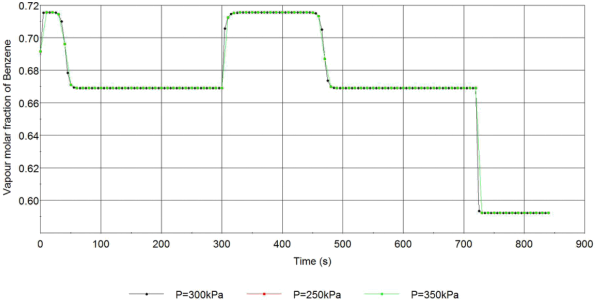
Figure.5 Vapour mole fraction of Benzene at the top of the column at different operating pressure
In the figure above, the vapour mole fraction of Benzene at the top of the column with 3 different operating pressures is presented, the difference between these three curves is extremely small. The reason for this observation will be the gas thermodynamic model in the multiflash when we calculate the volatility. In the model selected for the simulation, the liquid activity coefficients and the vapour fugacity coefficients for each component will be 1 constant at all temperatures and pressure.
Conclusion
In the result shown above, the system has very good stability, the variables will remain constant quickly after the column parameter changes. All the change in column parameter usually has a rapid change on the output variables, which is due to the linear tray hydraulics and the equimolar flow assumption, these two assumptions bring immediate flowrate change in the column, which will be impossible in the real operation, also the immediate molar fraction change in Figure.1 and Figure.2 is because of the perfect mixing. Due to the missing energy balance, the pressure and temperature difference between each tray will not be present in the model, which leads to an inaccurate sensitivity analysis of the temperature and pressure in the column, for example, the curve is the same in Figure 5.
2024-01-18