CITS 2401 Computer Analysis and Visualisation
Hello, dear friend, you can consult us at any time if you have any questions, add WeChat: daixieit
CITS 2401 Computer Analysis and Visualisation
Assignment 3: Advanced Data Processing and Visualisation
1. Outline
In an online review site, customers can share their experiences which can help others to make informed decisions about cafes, supermarkets, restaurants, auto-repair shops, and so on. A review made by a customer may have several emotions (e.g., sad, happy, surprise, disgust, joy, etc.) associated with the review texts. Also, the reviews in the online sites have other valuable data such as the information related to the user (e.g., userID) who made the review, posting time of the review, location coordinates, etc. The reviews of customers have a huge impact on business as a customer’s emotions about the business site are concealed in their perspective reviews. Therefore, such information from an online review site can provide several opportunities for a data analyst to analyse and visualize the data in a sophisticated manner.
In this assignment, you need to perform some tasks that are related to the scope of location-enabled online review data analytics. The instructions and the expected outcomes of the tasks are provided in Section 2 of this document. Materials necessary to complete this assignment include lectures up to week 11 Interpolation and Curve Fitting, and their related labs.
You are provided two sample csv files location_review_data.csv and user_friend_data.csv, where, the first file contains 13 columns with header created_at, user_ID, review_ID, latitude, longitude, location_ID, friend_count, follower_count, sad, happy, surprise, disgust, joy. The first eight columns of the file contain information on (1) time of posting a review, (2) user id (who made the review), (3) review id (id associated with review), (4) latitude, (5) longitude, (6) location id of the location where the review posted, (7) number of friends, (8) number of followers of the user who posted the review. The last five columns of the file contain the scores (between 0 and 1) for five user-emotions. Note, the column values associated with friend_count, follower_count are masked. The second csv file user_friend_data.csv contains user_ID, friend_count, follower_count, user_locID, where the column user_locID contains the location of the users (user_ID).
Note:
1. This is an individual assignment, please don't share your solution/code/files with others (only high-level discussion is allowed, e.g., the syntax of the formula, use of modules with other examples etc.). If it is found to be not your original work, then you will be reported to Academic Conduct Advisor.
2. You should not use any print() statement in your submitted code on the Quiz Server. However, you can use print() statement to test your code’s output in Python’s IDE (e.g., Thonny, Wing101, etc.).
3. In case you find any technical difficulties, please post them on Help Forum in LMS. Our teaching team will assist you. But, do not share your code on the Help forum. You can ask lab facilitators on your registered face-to-face/online labs in case you face any problem on your programming.
2. Tasks
You will find example test cases for the below mentioned tasks once you start the quiz on the Quiz Server. Two sample csv files location_review_data.csv and user_friend_data.csv are available in the Assignment 3 Instructions (CITS2401-Sem2) Folder on Quiz Server.
Task 1. Load data in NumPy Array (4)
Write a function load_mydata(filename) that considers filename (type string) as input. The filename should be a csv (comma separated values) file with the columns created_at, user_ID, review_ID, latitude, longitude, location_ID, friend_count, follower_count, sad, happy, surprise, disgust, joy as given in the sample data file location_review_data.csv. The function will extract the data (including the column headers) corresponding to the nine columns in the order as follows:
1. created_at2. user_ID3. review_ID4. location_ID5. sad6. happy7. surprise8. disgust9. joy
The extracted data should be stored in the NumPy array format (i.e., it should produce <class 'numpy.ndarray'>). No other post-processing is needed at this point. The resulting output will now be known as data.
Note: when importing, set the delimiter to be ',' (i.e., a comma) and the quotechar to be '”' (i.e., a double quotation mark).
Task 2. Formatting Datatype (4)
The datatype of the array created by NumPy in Task 1 is unstructured. This is because, in the default setting, NumPy decides the datatype for each value. Also, the output in Task 1 contains the header row that may not be required in our assignment. So, remove the header row and convert all the columns to type float (i.e., "float") apart from the columns specified by the input parameter indexes (mentioned below). Also, the remaining columns which are not mentioned in indexes should be in Unicode of length 30 characters (i.e., "<U30"). Finally, every row is converted as a type tuple (e.g., tuple(i) for i in data).
Write a function data_type_format(data, indexes) that can complete the above-mentioned task, where, the input data is a NumPy array and indexes contains the column indices (in list) which are to be converted into <U30 data type, and the remaining columns in data which are not in indexes will be converted to type float.
Task 3. Formatting Date Time (4)
The "created_at" column of the NumPy array (say in the output array 'data' in Task 1) is obtained by loading the csv input file (e.g., location_review_data.csv) contains the time of each review post. But, the current time format is not ideal for comparison between an old review and a new one. To change this, we are going to reformat the column (we got the type of the "created_at" column as Unicode of length 30 after conversion in Task 2).
Write a function convert_to_datetime(array) that converts the current (e.g., original) timestamp format into a new format as follows:
Current format: [day] [month] [day value] [hour]:[minute]:[second] [time zone difference] [year]
New format : [year]-[month value]-[day value] [hour]:[minute]:[second]
For example, a current format value:
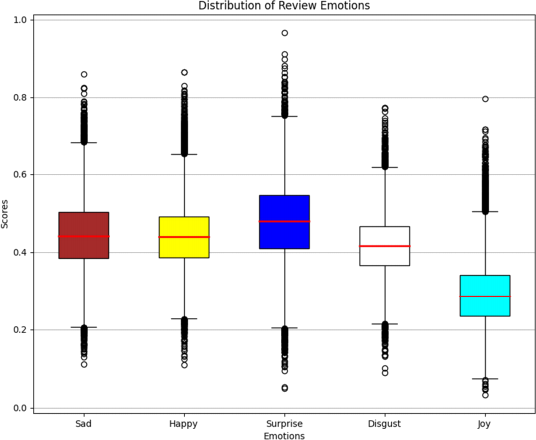
Task 4. Box Plot (6)
The dataset location_review_data.csv provided for this assignment contains a series of measurements (i.e., scores) for five emotions (such as sad, happy, surprise, disgust, joy) corresponding to each review made. The box (or boxes and whiskers) plot is a good choice to visualise and compare the emotions in the dataset.
Write a function box_plot(data, output_name) that takes the input data (type NumPy Array) and output_name (type String) where data contains the data available in the location_review_data.csv file (Hint: Q1) and output_name is the file name (output.png) to be plotted using the below instructions.
● Make a boxplot for each of the 'sad', 'happy', 'surprise', 'disgust', and 'joy' emotions from the data, in the order provided.
● Figure size should be set to (10, 8).
● The linestyle is set to '-', linewidth = 2, and color to red (hint: lookup medianprops).
● Patch_artist of the boxplot is set to True.
● Set the facecolor order as brown, yellow, blue, white, cyan.
● Set the title to be 'Distribution of Review Emotions'.
● Add x-axis data labels 'Sad', 'Happy', 'Surprise', 'Disgust', 'Joy' in this order.
● Set the y-axis grid to True.
● Set the x-axis label to 'Emotions'.
● Set the y-axis label to 'Scores'.
● Finally, save the graph as output_name with a default value "output.png".
The expected output is shown below using the provided using the sample dataset (location_review_data.csv).
Task 5. Count Outliers (5)
As seen in the boxplot figure, there are several points that are outside of the boxes. For this task, we will calculate the number of outliers for a selected emotion (e.g., sad, happy, surprise, disgust, joy), specified by upper and lower boundary values.
Write a function count_outliers(emotion, lower, upper) that considers three inputs emotion, lower, upper, where emotion contains the records corresponding to any one among the five emotions (e.g., sad, happy, surprise, disgust, joy). The function count_outliers(emotion, lower, upper) should return the number of outliers in the provided data range emotion (among the five emotions mentioned above), with given lower and upper percentile. For example, if lower = 25 and upper = 75, then you should regard all the points below 25% and above 75% as outliers, inclusive.
Note: The input parameter emotion is of class numpy.ndarray.
Task 6. Euclidean Distance between Two Emotions Array (2)
The Euclidean distance (ED) between two numpy array arr1 = [x1 y1] and arr2 = [x2 y2] can be calculated as follows.
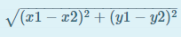
The ED calculation formula can be extended to higher dimension vectors also.
Write a function euclidean_dist(emotion1, emotion2) that takes two vectors emotion1, emotion2 of class numpy.ndarray as input parameters, and returns the Euclidean distance (ED) score between emotion1, emotion2. If the sizes of the input parameters are different, the function should return None.
Note: You cannot use for or while loop for this question. You can use the math module and it has been imported already in the Quiz Server (e.g., import math.)
Task 7. Import Specific Columns to Dataframe (4)
Write a program import_to_dataframe(filename, columns) which can import the contents of specific columns (type list of integers) of an input csv file filename to a pandas dataframe. Here, columns is a list of integers that contains the index of the columns to be imported into the dataframe (e.g., <class 'pandas.core.frame.DataFrame'>).
For example, if columns = [0, 1, 2], the dataframe will import the first three columns of the input filename.
Task 8. Convert NumPy Array into Dataframe (4)
Pandas provide various methods that can be used to handle data more efficiently. In this task, you should convert NumPy array data into Pandas dataframe type.
Write a function convert_to_dataframe(data) that consider input data of class numpy.ndarray and convert it into the Pandas dataframe type.
Note: Consider the data's dtype names as column headers and their associated data values.
Task 9. Load Data to Dataframe (4)
Write a function load_mydataframe(filename) where the input parameter filename (type string) is a csv file (e.g., location_review_data.csv) having 13 columns (e.g., created_at, user_ID, review_ID, latitude, longitude, location_ID, friend_count, follower_count, sad, happy, surprise, disgust, joy). The function load_mydataframe(filename) should extract 9 (Nine) columns in the order as follows:
1. created_at2. user_ID3. review_ID4. location_ID5. sad6. happyPage 5 of 67. surprise8. disgust9. joy
The extracted data should be stored in the pandas dataframe format (i.e., it should produce <class 'pandas.core.frame.DataFrame'>). No other post-processing is needed at this point. The resulting output will now be known as my_dataframe.
Note: when importing, set the delimiter to be ',' (i.e., a comma) and the quotechar to be '”' (i.e., a double quotation mark).
Task 10. Load User info Records to Dataframe (3)
Write a function load_user_info(filename) that considers the input filename (type string) as a .csv file and returns the Pandas dataframe of the records from the filename. You can assume that there must be some data in the file filename (e.g., the file filename should not be empty).
Note: The data separator of the input file should be a comma (e.g., ',').
Task 11. Merging Dataframes (5)
You may notice that the friend_count and follower_count columns of the sample csv file location_review_data.csv are masked (e.g., no numeric values are available). You are provided another csv file user_friend_data.csv that contains the number of friends (e.g., friend_count) and the number of followers (e.g., follower_count) corresponding to each user_ID. In Task 9 (e.g., Q 9) and Task 10 (e.g., Q 10), you have loaded the file location_review_data.csv (with specific 9 columns) and user_friend_data.csv (4 columns) into the memory space as a Pandas dataframe type, respectively. As both the dataframe has the common column header user_ID, we will use that information to join two dataframes (refer Task 9 and Task 10) to form a single dataframe.
Write a function merge_dfs(df_data, df_users) that takes two dataframes df_data and df_users as inputs. Note, the inputs df_data and df_users contains the dataframes returned by the functions load_mydataframe() and load_user_info() of Task 9 (e.g., Q 9) and Task 10 (e.g., Q 10), respectively.
In this task, the function merge_dfs(df_data, df_users) should perform the following tasks:
(1) Join the two dataframes df_data and df_users using the user_ID (Note: check user_ID should be common to both the dataframes). The join method is 'inner' (will come in handy). As not all rows will match the user_ID (as some user_ID (i.e., 151421, 45097) may not available in df_users dataframe), make sure to drop those records (row containing these user_IDs that are not available in both dataframes). Finally, the function will create a single dataframe df_merged by joining the dataframes df_data and df_users.
(2) Finally, return the dataframe df_merged
Hint: You must use the pandas dataframe join method.
Note: depending on your approach, this task may take time.
Task 12. Combining of the Above Tasks (Task 1 to Task 11) (5)
Submit your Python code in the box (under Question 12 on Quiz Server) containing the functions to solve all the above-mentioned tasks. You also need to upload a python file (.py) on the Quiz Server as detailed in Section 3. Failure to upload the Python file will result in a penalty of 50% of entire assignment.
3. Submission
You are expected to have read and understood the University's guidelines on academic conduct. Following this policy, you may discuss with other students the general principles required to understand this project, but the work you submit must be the result of your own effort. Plagiarism detection, and other systems for detecting potential malpractice, will therefore be used. Besides, if what you submit is not your own work then you will have learned little and will, therefore, likely, fail the final exam.
You must submit your project before the submission deadline listed above. Following UWA policy, a late penalty of 5% will be deducted for each day (24 hours), after the deadline, that the assignment is submitted. No submissions will be allowed after 7 days following the deadline except approved special consideration cases.
Submit your Python code in the quiz answer box containing all the functions related to the tasks on the quiz server (already mentioned in Task 13), as well as a python file which you should name as A3_StudentId.py. For example, if your student ID is 12345678, then your file name is A3_12345678.py.
Fail to follow the instructions in this assignment may result in zero grade.
2021-10-19
Advanced Data Processing and Visualisation