Empirical Assignment 2: Instrumental Variables
Hello, dear friend, you can consult us at any time if you have any questions, add WeChat: daixieit
Empirical Assignment 2: Instrumental Variables (25 points)
DL: Jan 19 11:59pm (Class A), Jan 12 11:59pm (Class B)
Specifcation of the report: Page limit (excluding Stata codes, but including tables and igures) is 4. Font size is 12, and line spacing is 1.5.
Does better institutions promote economic development? Figure 1 presents the positive relation between national income and expropriation risk (a measure of institutional quality). Nevertheless, there are a number of important reasons for not interpreting this relationship as causal. First, rich economies may be able to aford, or perhaps prefer, better institutions. Arguably more important than this reverse causality problem, there are many omitted de- terminants of income diferences that will naturally be correlated with institutions.
Acemoglu, Johnson and Robinson (2001) use the mortality rates of European settlers more than 100 years ago as the instrument for the contemporaneous quality of institutions. They argue that European settlers were more likely to settle in the countries with more favorable disease environment (i.e., mortality rate is lower). In those countries, institutions were more likely be modeled after settlers’ home countries. In countries where disease en- vironment was harsh, they were more likely to set up extractive states with the intention of transferring resources rapidly to the metropole. Moreover, institutions set up during the colonial era persisted and afected today’s institutional quality.
The dataset includes the following variables:
. shortnam: 3 letter country name
. lat abst: absolute value of latitude
. logpgp95: log PPP GDP per capita in 1995
. logem4: log settler mortality
. baseco: dummy variable equals to 1 if the country belongs to the baseline sample, and 0 otherwise
. africa: dummy=1 for Africa
. asia: dummy=1 for Asia
. other: dummy=1 for countries not in Asia, Africa, or America
. Malfal94: Falciparum malaria index 1994
Figure 1: OLS Relationship Between Expropriation Risk And Income
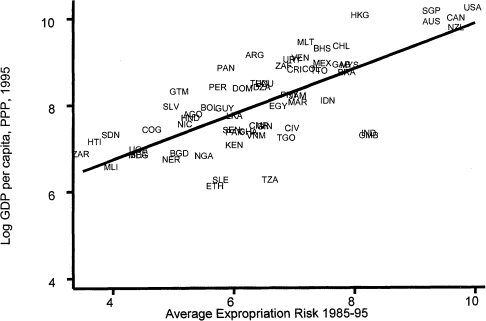
Source: Acemoglu, Johnson and Robinson (2001)
In the following exercises, we will restrict the analysis to the baseline sample.
1. Produce a igure (like Figure 1) to check the correlation between expropriation risk and log settler mortality. Based on the igure, comment on whether the instrumental variable satisies the Relevance Condition. Regress the expropriation risk on log settler mortality (Column 1 of Table I) and report the regression results. We then gradually augment the regression model with diferent controls (Columns 2-4 of Table I). Summa- rize the results from these speciications: (i) Is the coefficient oflog mortality sensitive to diferent regression speciications? (ii) Interpret the estimated coefficients of Africa dummy, Asia dummy and other continent dummy. [5 points]
2. Investigate and report the association between income and institutional quality using OLS regression models (Columns 1-4 of Table II). Based on the model in column (2), interpret the coefficient of Latitude. Why is the absolute value of latitude correlated with income? (Provide some hypothesis.) Based on the model in column (4), interpret the coefficient of Malaria index. Why is the malaria intensity correlated with income? (Provide some hypothesis.) [5 points]
3. Investigate and report the causal efect of institutional quality on income using IV regression models (Columns 5-8 of Table II). Summarize the results from these re-gressions: (i) Is the coefficient of expropriation risk sensitive to diferent regression speciications? (ii) Interpret the estimated coefficients of Latitude and Malaria index and make a comparison with their counterparts from the OLS models. Comment on the diferences. [5 points]
4. What is the Exclusion Restriction in the context of this study? What kind of factors can lead to violation of the Exclusion Restriction? If it is violated, how will the IV estimator for expropriation risk be biased? Does the paper alleviate these potential concerns? If not, how will you address them? [5 points]
5. Compare the OLS and IV estimates. Provide some explanations for the discrepancies. [5 points]
2024-01-17