EENG31400 / EENGM1400 DIGITAL FILTERS AND SPECTRAL ANALYSIS 2017
Hello, dear friend, you can consult us at any time if you have any questions, add WeChat: daixieit
UNIVERSITY OF BRISTOL
January/February 2017
Faculty of Engineering
Examination for the Degrees
of
Bachelor of Engineering
Master of Engineering
Master of Science
EENG31400 / EENGM1400
DIGITAL FILTERS AND SPECTRAL ANALYSIS
Q.1 Figure Q1 shows the magnitude spectrum X[k], for k=0,1…512 resulting from applying a DFT of length N= 1024 to a discrete time audio signal x[n], using a rectangular window of length 1024. The audio signal x[n] contains a noisy component - a large magnitude high frequency sinusoid - that appears in the DFT spectrum of Figure Q1 as an impulse at location k=23. Answer the following questions:
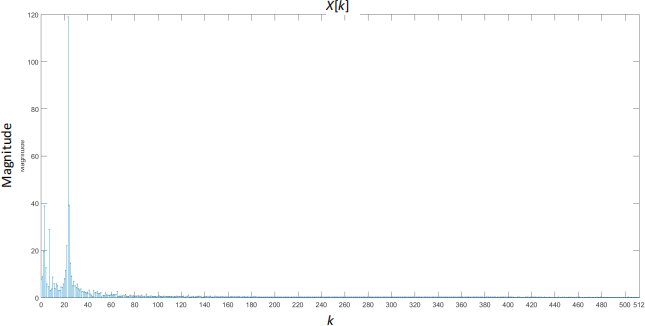
Figure Q1
(a) Which normalised angular frequency Ω does index k=512 correspond to? (2 marks)
(b) Which normalised standard frequency F does index k =256 correspond to? (2 marks)
(c) Assume that the discrete time signal x[n] resulted from sampling a continuous time signal x(t) with sampling frequency fs = 44.1 KHz and no aliasing. What analogue frequency f does index k=23 (the location of the noisy component in the spectrum) correspond to. In other words what is the estimated frequency of the unwanted large magnitude sinusoid contained in x[n]. (4 marks)
(d) The actual frequency of the unwanted large magnitude sinusoid contained in x[n] is 1000Hz. Does your answer in the previous question agree with this? If not explain why. What is the smallest value of N greater than 1024 that would correctly show the frequency of the noisy component as being 1000Hz? Justify your answer.
(e) Use the pole-zero placement method to design a suitable IIR digital filter for removing the unwanted sinusoid of frequency f = 1000Hz. Sketch the pole-zero diagram and give the transfer function. (6 marks)
Q.2 A sound card uses an oversampling analogue to digital converter (OADC) to convert analogue audio signals to discrete time signals. A block diagram describing the operation of the OADC is shown in Figure Q1a. The input continuous time signal xc(t) goes through a simple antialiasing (AA) filter with a cut-off frequency ωc that is a lot greater than the Nyquist frequency ωN, as shown in Figure Q1b, where Xc(ω) is the Fourier transform of xc(t). The Fourier transform Xa(ω) of the filtered signal xa(t) (Figure Q1c), shows that xa(t) contains the signal of interest plus band-limited high frequency noise. Signal xa(t) is sampled with a very high sampling rate ωs =ωc+ωN >> ωN, resulting in the discrete time signal xs [n]. The discrete time signal xs [n] is then passed to a decimator that reduces the sampling rate to the Nyquist rate, resulting in signal xd[n]. Answer the following questions:
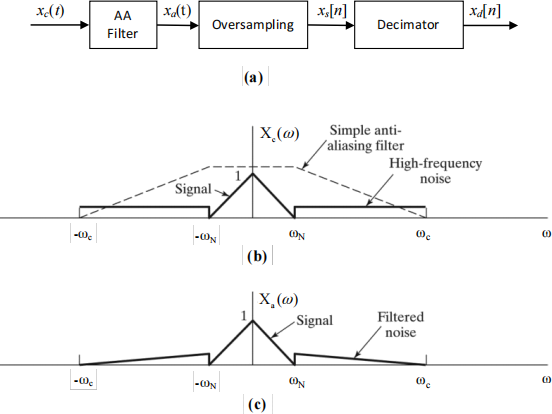
Figure Q2
(a) Sketch the Fourier transform Xs(ω) of the sampled signal xs [n]=xa(nTs), where Ts is the sampling period. Denote all relevant frequencies.
(b) Sketch the DTFT Xd(Ω) of signal xd[n].
(c) What is the normalised radial cut-off frequency of the low pass filter used in the decimator if ωc =3ωN ? (4 marks)
Q.3 (a) Following the windowing method of FIR filter design, use a Hamming window to design an 8th order (9 tap) band pass FIR filter with a pass-band between 200Hz-400Hz and a sampling frequency of 1200Hz (12 marks)
(b) Figures Q3a and Q3b show the pole zero diagrams and frequency responses (magnitude) of 8 discrete-time causal LTI systems. The order of the pole zero diagrams has been mixed up. Match each pole zero diagram to the correct frequency response.
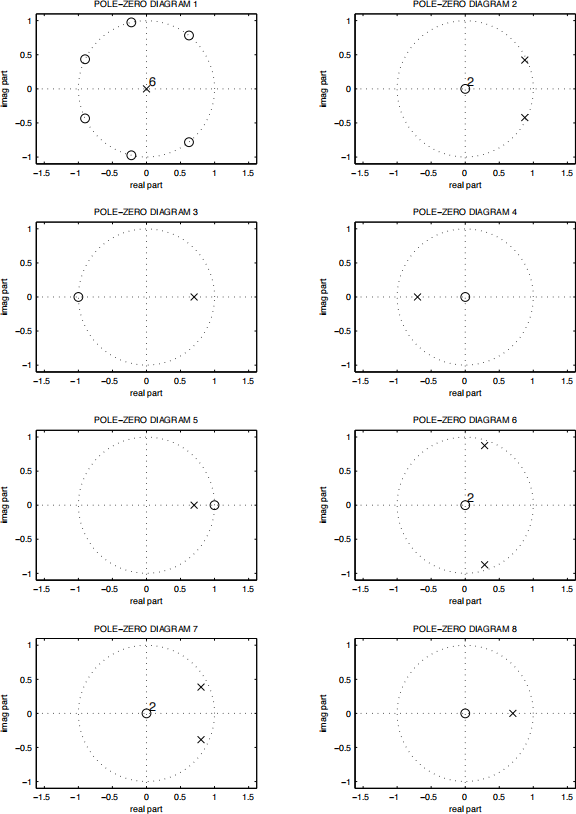
(a)
Figure Q3
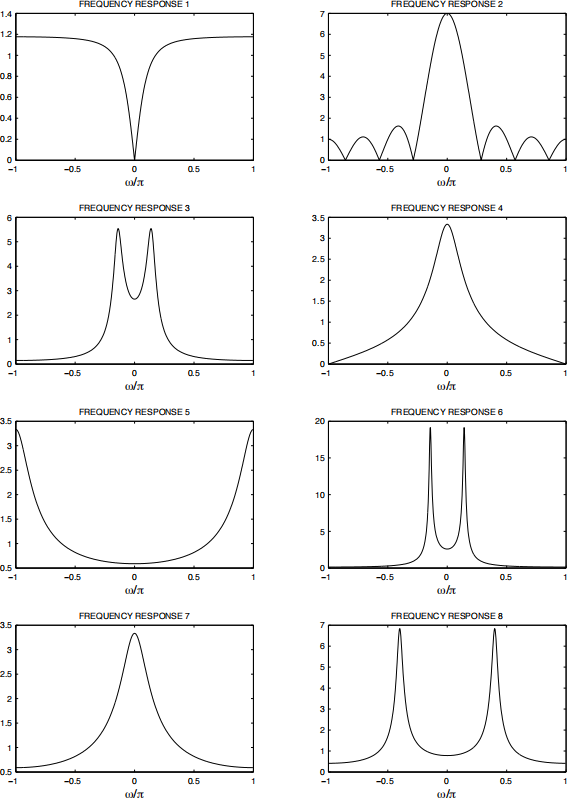
(b)
Figure Q3
2024-01-17