FND115 Financial Decisions Assignment
Hello, dear friend, you can consult us at any time if you have any questions, add WeChat: daixieit
FND115
Financial Decisions Assignment (20%)
DUE: Thursday Week 12
Worth: 20%, 20 Marks.
Please note this is a hypothetical assignment, please do not ‘buy’ any coins or shares in real life for this assignment. This assignment is not meant to act as financial advice. Please seek a professional financial advisor for any information regarding your finances if you are interested in investments.
Academic integrity
Submissions will be via Turnitin and checked for plagiarism. MS Excel (or similar) spreadsheets must also be submitted with version history and will be verified. Suspected academic integrity breaches will be subject to investigation in conjunction with formal academic integrity breach policy. Academic integrity breaches include:
· Plagiarism: submitting the work of another as your own without due citation. This includes using another student’s completed spreadsheet and copy-pasting your data over the top.
· Collusion: submitting individual assessment based on sharing answers or working without instructor permission within a group.
· Fabricating: presenting invented data.
· AI written Assignments: AI probability will be calculated. Any high matches will be required to conduct an oral exam.
Aims
In this assignment you are going to play the part of a financial advisor advising a client who had $10000 to invest for 5 years. You will select one stock/crypto currency, plot and fit it with a linear equation, then use this model to predict the price in five years, and thus the expected profit were your client to invest the money in the stock/crypto today. You will compare this with a high-interest compound savings option for the same time period in a report format (see template) and advise the client on which option you believe best suits their needs.
Your report should contain the following elements:
1. Synopsis (2 marks): This is a summary statement that presents the problem, your client’s needs (you can decide their age, status etc.) and your approaches to solving it. It should also include a statement that summarises your position (advice) to the client.
2. Data analysis (10 marks total)
Historical data analysis stock/crypto (6 marks)
1. Identify a suitable stock that is increasing in value over time. I suggest using the ASX website initially to identify a suitable stock as it is important to choose stocks that trade in AUD (so you can compare to the compound interest option). Unfortunately, it is not easy to download data from this site, so once you have a share and code, move onto the next step.
2. You can download your data from Yahoo Finance into a CSV file. Go to the search bar and search for your stock/crypto using 3-letter code .AX (e.g. ABC.AX), this gives you the share in AUD. Make sure your choice is increasing over time (you wouldn’t recommend a falling stock, would you?).

Select your stock. Then go to Historical data tab. Select the appropriate timeframe, press apply and download.

3. Go to downloaded files and open in MS Excel or Google Sheets. I suggest you save it as an .xlsx file to ensure it behaves properly.
4. Remove any data you don’t want plotted. It is your decision what data to include (you will want recent data, but may want to cut earlier GFC data) and you will justify the timeframe you choose (see template for example).
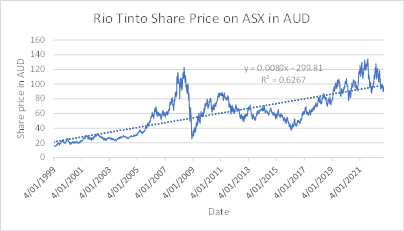
5. Graphically represent (for a video of plotting and fitting your data using MS Excel, click here) the stock/crypto price over the timeframe you chose (2 marks for all graph elements). You will want the data treated as variable rather than a category, so I suggest a scatter plot. Make sure your data is in AUD (use the stock code with .AX) so it can be compared to the Financial investment option in the next section (you can find companies on the, in Yahoo Finance just as .AX to the 3 letter code). Possibilities by sector include:
Energy: SOL.AX, VEA.AX, WHC.AX, NHC.AX
Consumer software and services: IEL.AX, BRN.AX, SQ2.AX, ALL.AX, WTC.AX, REA.AX
Real Estate: CQE.AX, SCG.AX, DXS.AX
Materials: ABC.AX, PLS.AX, LKE.AX, CHN.AX, BKW.AX
Telecommunications: TLS.AX, TPG.AX
Food: WOW.AX, WES.AX
Banks, Financials, Crypto: CBA.AX, NAB.AX, WBC.AX, BEN.AX, BTC-AUD, ETH-AUD, USDT-AUD, BNB-AUD
6. Report appropriate summary statistics (one measure of central tendency and one measure of dispersion, here is a MS Excel statistics video). State why the summary statistics you present are appropriate (or not) for this data. (2 marks).
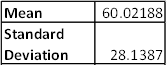
7. Fit the data with a linear function (this can be done easily in MS Excel using add trendline with equation) and regression coefficient. Show evidence that this model is a good fit (2 marks). Ignore dividends.
High interest compound interest option (4 marks).
8. Find a current high interest compound interest option (such as a high interest savings account, or you can use these details: 5.13% p.a. on the first 4 months and 4.00% p.a. thereafter, compounded monthly) and present it as an appropriate model (equation/s) clearing showing interest rate, compounding frequency, term and principal (2 marks). Treat interest rate as ongoing rather than variable.
9. Present pros and cons of an interest investment versus stocks or variable interest investments (2 marks).
3. Predictions and summaries (4 marks)
· Using your linear fitting of the stock and compound interest equation to predict the profits of both at 5 years. Show your calculations (3 marks).
o N.B. In my example MS Excel referenced x back to 01/01/1900 (if you know of a better way to deal with this, please educate me), so if you wanted to find the amount in 5 years Oct Jan 2023, it would be (2028-1900)*365.24 + 310.
10. Present appropriate numbers for both options in a table summary (1 mark)
2. Data evaluation and recommendations (4 marks)
This section should have the following elements (and should be only 2 paragraphs long)
Which option would you recommend to your client and why? Are there complexities that aren’t considered in your models and how would you expect these to impact on the predicted outcomes? If your client wants great surety in the data what would you recommend
Assignment rubric
|
Section |
Marks |
|
1. Synopsis a. Clients circumstances and needs stated. b. Your approach and conclusions summarised |
1 1 |
|
2. Data analysis a. Stock i. Professional graphical representation (appropriate range, axes labelled, data plot appropriate) with MS Excel or similar ii. Timeframe for data justified iii. Appropriate fitting with equation and R2 iv. Fitting justified and caveats discussed v. Appropriate summary statistics presented vi. Summary statistics choice and interpretation b. Compound investment option i. Compound investment option identified ii. Compound interest equation and values given iii. 2 pros and 2 cons of interest option versus stock option given |
1
1 1 1 1 1
1 1 2 |
|
3. Predictions a. Models from (2) are used to predict amounts/profit at 5 years. b. Calculations shown c. Professional summary table given |
2
1 1 |
|
4. Data evaluation and recommendation a. Data recommendation is explained. b. What factors not accounted in your models are sure to affect the outcomes and how will they affect the outcomes? |
2
2 |
Assignment working
MS Excel (or Google Sheets)
Download data on stock of choice in CSV format from Yahoo Finance (or other) and import into MS Excel (or similar). Produce data plot (scatter plot will treat the data as a variable, which is what we want) and fitting.
Calculations for the Predictions sections may be done in MS Excel or by hand, whichever suits you better. I would recommend doing summary statistics in MS Excel. Some helpful videos:
Inserting charts and adding trend lines and trend fit equations in MS Excel
Calculating summary statistics and formatting tables in MS Excel
2024-01-10