Workshop 3. OLS Violations
Hello, dear friend, you can consult us at any time if you have any questions, add WeChat: daixieit
Workshop 3. OLS Violations
Econometric Methods
Download the “Workshop 3 Data.xlsx” file to complete the exercises below.
Question 1. OLS violations detection
Import the data from “HSBA” sheet. It contains daily data on the following variables for HSBC stock over the period from January 2018 until November 2019: (1) traded volume (Volume, mln), (2) traded value (Turnover, bln), (3) market capitalisation (MarketCap, bln), (4) book-to-market ratio (B2M) and (5) stock log-returns (Ret, %).
1. Estimate the equation (1) using OLS and report the estimation results.
Rett = γ0 + γ1Volumet+ γ2Turnovert+ γ3 MarketCapt+ γ4 B/Mt+ ϵt (1)
2. Briefly comment on individual and joint significance of the coefficients.
3. Perform White’s and Breusch-Godfrey tests for heteroscedasticity and autocorrelation (up to order 5), respectively, at 95% confidence level. Do you find evidence of presence of either heteroscedasticity or autocorrelation, or both?
4. Re-estimate equation (1) making any necessary adjustments following your answer to the sub-question 3. Are there significant changes relative to your results in sub-question 1?
5. Calculate the VIF factor for each of the regressors. Is there anything of concern? How would you handle the problem. Re-estimate the model, implementing your suggestion. Is the problem resolved?
6. Finally, perform Jarque-Bera and Ramsey RESET tests. Do you find evidence of non- normality in the errors or wrong functional form being adopted?
Question 2. Weekday effect in stock returns.
In this question you will test for a stock market anomaly called ‘weekday effect’. Import the data from “AAPL” sheet. It contains three columns: (1) dates; (2) weekdays corresponding to each date, where 1 stands for Monday, 2 for Tuesday, 3 for Wednesday, 4 for Thursday and 5 for Friday; and (3) closing prices of Apple stock. The data are daily and cover the time period from January 2001 until May 2021 inclusive.
1. Compute the daily returns on Apple stock and construct a dummy variable Dj,t for each weekday j = {1, 2, 3, 4, 5}. For example,
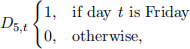 (2)
(2)
and analogically for other weekdays.
2. Estimate the equation (3) using OLS and interpret the results. Is there evidence of any weekday effect?
rt = β1D1,t+ β2D2,t+ β3D3,t+ β4D4,t+ β5D5,t+ υt (3)
where rt is daily return on Apple stock on day t, and Dj,t , j = {1, 2, 3, 4, 5} are dummy variables constructed above.
3. Re-estimate equation (3) with HAC standard errors (Newey-West method) and compare results with those based on OLS standard errors.
4. You probably noticed that the model equation (3) does not have an intercept. Why do you think the intercept is omitted?
Question 3. When did the Momentum Crash start?
In this question you will have a closer at the famous Momentum Crash 2009. Momentum has lost 83.36% back then, most of which happened over a three months period. Import the data from “MOM” sheet. It contains daily returns on momentum from January 1975 until August 2021.
1. Conduct a QLR test on mean returns to estimate potential date of a break in momentum portfolio returns. Use 15% trimming. What is the outcome of the test? What is the estimated breakpoint date?
Hint: use the following model equation
Momt = α + ut (4)
2. Save all F-statistics from the QLR test in the previous question and plot them over time. Are there other potential breaks in momentum behaviour?
2024-01-08