M30289 STATISTICS AND DATA MODELLING 2023-24
Hello, dear friend, you can consult us at any time if you have any questions, add WeChat: daixieit
BAL – SUBJECT GROUP OF ACCOUNTING AND FINANCIAL MANAGEMENT
STATISTICS AND DATA MODELLING
M30289
COURSEWORK ASSIGNMENT
2023-24
COURSEWORK ASSIGNMENT
This is an individual assignment (although, you can still work in groups if you wish
so but you still need to produce individual reports) and accounts for 100% of the final module mark. The assignment consists of three sections, namely Section A, Section B and Section C. To pass, you will need to answer the questions in all three sections (attempt all parts), and it should obviously all make good sense! The hand-in date for the assignment is FRIDAY 12th JANUARY 2024.
The Intended Learning Outcomes of the Assignment are:
. To introduce to the student the fundamental concepts which can be used to understand and improve the process of decision-making.
. Use appropriate statistical methods to analyse a variety of financial decisions.
. Use appropriate methods to analyse a variety of financial decisions.
Section A – Multicriteria Decision Analysis
It is predicted that the UK is still completely failing to build enough homes to meet the
demands of first-time buyers. That means there remain millions of would-be buyers who have little choice but to continue to rent and there will continue to be plenty of tenants to attract.
You are acting as a consultant for an estate agency in data analysis tasks that enhance
decision making. A client of the agency would like to invest in a buy-to-let property in England. An AI-powered technology has pinpointed five UK property investment hotspots in 2023 based on filtering, that match both the profile of potential tenants and the needs of the client. The details are summarised in Table 1.
Table 1. Property investment alternatives
|
Property location |
Price (x1000 pounds) |
Size (Sq.metres) |
Rooms |
Area price growth in 5 years |
Amenitie s nearby |
Noise during peak hour(db) |
|
Salford Quays |
260 |
125 |
3 |
0.06 |
2 |
70 |
|
Newcastle Bridge |
325 |
120 |
4 |
0.03 |
3 |
65 |
|
Gunwharf Quay |
420 |
165 |
5 |
0.07 |
3 |
60 |
|
Liverpool Docks |
465 |
160 |
5 |
0.08 |
4 |
65 |
|
Canary Wharf |
1500 |
200 |
4 |
0.1 |
5 |
50 |
This investment decision will be based the following criteria.
. Price (x£1000): the overall price paid by the client, including any fees, land tax, etc.
. Size (in square metres): the overall size of the interior living space
. Rooms: the number of rooms in the property
. The area’s projected price growth in the next 5-years (figures based on agency’s estimates)
. Nearby amenities: the number of amenities within a 100-yards radius
. Noise during peak time: Noise measured in the interior of the house (in db) during the peak hour window of 15:00-18:00
In line with the client’s preferences, price and noise should be minimised, whereas size, number of rooms, projected price growth and nearby amenities should be maximised.
In the modelling stage, assume a linear preference function for all criteria, with the
indifference and preference thresholds set to 0 and maximum pairwise difference accordingly. This can be done by setting the two sliders entirely to the left and right in Smart Picker Pro.
You are required to make use of the AHP and PROMETHEE methods to answer the following two questions and sub-questions. In principle, you will 1) derive weights for the criteria using AHP; 2) make your decision using the PROMETHEE method.
Q1. After you have conducted a survey about your client’s preference, you find that her pairwise criteria preferences are as follows:
Table 2. The client’s pairwise criteria preferences are given below:
|
|
Price |
Size |
Rooms |
Projected price growth |
Nearby amenities |
Noise during peak time |
|
Price |
|
3.0 |
3.0 |
2.0 |
5.0 |
(2.0) |
|
Size |
|
|
3.0 |
(2.0) |
5.0 |
(3.0) |
|
Rooms |
|
|
|
(3.0) |
4.0 |
(2.0) |
|
Projected price growth |
|
|
|
|
5.0 |
(3.0) |
|
Nearby amenities Noise during peak time |
|
|
|
|
|
3.0 |
a. Find the weights that correspond to those preferences and report them.
b. Is the client consistent in her choices by each criterion? Provide your explanations.
Q2. Using the weights assigned to each of the criteria, which you have obtained
from Q1, and the data from Table 1, set up relevant parameters in the Smart Picker Pro software according to the objective (Maximise/Minimise), and produce your analytical results. You are required to answer the following questions:
a. Which property offers the best performance? Explain why.
b. Which property offers the least regret? Explain why.
c. Combining performance and regret aspects, which property performs the best overall, taking into account all conflicting criteria? Explain why.
d. If the construction company fits an extra layer of sound-proofing materials, the noise levels in the property in Salford Quays can be reduced to 60db. How would that change your results, and what can you infer from this change as to the robustness of your evaluation?
e. Is there a significant difference compared to the second-best property?
As amanager leading the team responsible for answering this question, what would be your approach if there were extreme differences of opinion among team members? In what circumstances might you decompose the overall performance back to the elementary criteria?
When submitting your coursework, you should also submit your result tables and graphs.
Your report for Section A should not materially exceed 1,300 words in length.
Section B – Statistics and Regressions
The task is to model, or analyse, the following case study:
The data shown below lists the following three variables for fourteen geographical areas in Hampshire:
1. HEALTHY DIET - the percentage of the population that follow a healthy diet (according to the 5 a day guideline that recommends eating 5 different kinds of fruit and vegetable a day)
2. MEDIAN INCOME – the median income recorded per week
3. NO CAR – the percentage of the population that have no car
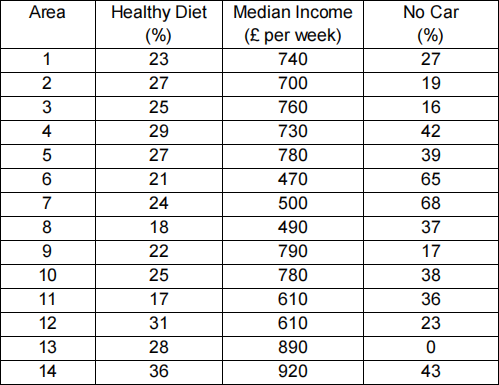
(So, for example, a value of 23 in the Healthy diet column would mean that 23% of the population maintain a healthy diet by following the recommended guideline of 5 different fruit and vegetables a day)
You are required to analyse the data above using the Microsoft Excel software. For
parts (c-e) below, do not use the standardised Excel functions – instead you should use Excel to apply the relevant formulas learnt in the course. Specifically, you should answer the following questions:
(a) Use Excel to construct a histogram to show the distribution of the variable Healthy diet (You will need to choose suitable class intervals).
(b) Discuss whether this distribution is normal.
(c) Calculate the quartiles of this distribution, and its inter-quartile range. Explain the meaning of the lower quartile (Q1) and the inter-quartile range in the context of the example data.
(d) Calculate the values of both Kendall’s and Pearson’s correlation coefficients between Healthy diet and Median income. Explain what a correlation coefficient means in general terms.
(e) Calculate the standard deviation of the Healthy diet data. Explain the meaning of the standard deviation in the context of the example data.
Now do a regression analysis using the Excel Regression Tool with Healthy diet as
the dependent variable, and Median Income and No Car as the independent variables. You will produce estimation result tables and graphs (i.e., regression coefficients and model fit statistics) to support your answers based on data in the table above.
(f) Present the regression results in a table, together with regression coefficients and P-values. Explain the meaning of the figures in the P-value column.
(g) Discuss the results of your regressions. What conclusions can be drawn from the regression analysis with regards to the effect of Median income and No car on Healthy diet? You will need to discuss the results based on the regression coefficients, P-values and other useful information in the output table.
(h) Report model fit statistics. Discuss the significance of the R-Squared value in your estimation results and what it tells us about a regression model.
(i) Suppose one wants to use the regression model to predict the percentage of people following a healthy diet according to the 5 a day recommendation in other areas in the UK. The chosen region has a Median income of 650 and 15% of the population in the region do not have a car. What is the estimated percentage of the population following a healthy diet?
(j) Discuss the limitations and strengths of your analysis and results. Consider what recommendations for further analysis you would make to enhance your analysis.
Your report for Section B should not materially exceed 1,400 words in length.
Section C – Monte Carlo Simulation
Glaxco plc, a major pharmaceutical company, is considering developing one of two mutually exclusive drug products. Product A requires an immediate investment of £2.5m and Product B requires £2m. Both products will have a life of three years. If there was no inflation, then the demand (in units), price (per unit sold), and the relevant production costs (total) for the three-year life of each of the products would be:
|
Item |
Product A |
Product B |
|
Demand |
2,100,000 units |
1,900,000 units |
|
Price |
£1/unit |
£1/unit |
|
Materials |
£800,000 |
£200,000 |
|
Labour |
£300,000 |
£700,000 |
|
Overheads |
£100,000 |
£50,000 |
The cash flows for each product are estimated as revenues minus costs. These cash flows can be assumed to arise at the year-ends of each of the three years. Specific annual inflation rates have been estimated for each of the cash flow elements:
|
Demand |
5% |
|
Materials |
4% |
|
Labour |
10% |
|
Overheads |
7% |
Furthermore, the total demand, materials, labour, and overheads for each product were estimated using various pieces of information. The demand for each product, for example, may not be precisely as estimated above because of various uncertainties. For this reason, they decided to use probability distributions to allow for a range of possible values for the above variables. The associated distribution for each variable and the parameters for each probability distribution are given in the following tables:
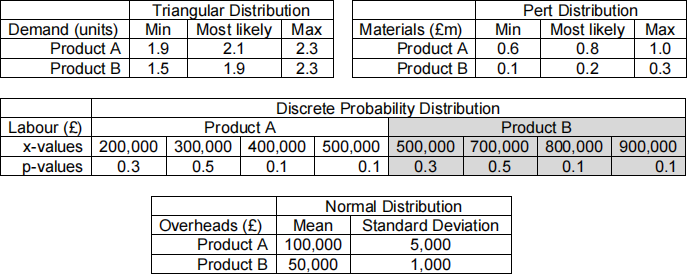
Finally, the cost of capital is 17 per cent per annum. However, there is a 20% probability that the company will take a loan to finance the development of the products. If that happens the cost of capital will drop to 16 per cent per annum.
(a) For the situation described above, develop first a deterministic model for the
Net Present Value (NPV) of each product. Use then the information provided for the uncertain variables to run a Monte Carlo simulation and present the results in relevant diagrams (you should at least have two graphs, each showing the simulated distribution of the NPV for each product).
(b) Discuss the recommendations you would make to the management of Glaxco on the basis of these diagrams.
(c) Discuss the advantages of using Monte Carlo simulation instead of a deterministic analysis.
Your report for Section C should not materially exceed 1,300 words in length.
Written Report
Your report should contain:
(1) A clear summary of your results.
(2) A brief and clear explanation of how you carried out the calculations.
(3) A critical discussion of your results and conclusions.
The requirements (1), (2) and (3) are very important. Make sure you try to achieve these in your written report.
For example, using clearly presented tables to summarise your results in (1) is good. Spending pages and pages describing in detail what the reader can clearly see from the tables is bad.
If you write a poorly structured report with a bunch of spreadsheets/printouts attached at the end, it is very difficult for the examiner to know what your results are, whether you have carried out the calculations correctly, what your conclusions are, and in general, whether or not you understand what you are doing.
Your aim in writing your report must be to convince the reader that you have complete confidence in applying these techniques, that you understand the ideas behind these applications, and that you can critically discuss the results and form reasonable conclusions.
Your Report Should
. Be written in a plain style, using subheadings and lists where appropriate.
. Be properly referenced acknowledging all the sources you have used, and only the sources you have used.
. Include evidence of locating and reading sources beyond the suggested initial reading.
Formatting
The work should be word processed. Font size should be between 12 and 14 and ‘easy to read’ e.g. Calibri, Arial, Times New Roman. Line spacing should be between 1.5 and 2 with (approx.) 4 cm margins all round. The Header must include the student number and the Footer must include a page number. There are no extra marks for excessive presentation; for example elaborate graphics on the cover sheet.
Hand-in Date
The hand-in date for Coursework Assignment 1 is FRIDAY 12th JANUARY 2024 by 23:55. The coursework report should be submitted via Turnitin on Moodle. Any supporting files you wish to submit (such as Excel files, Expert Choice files etc.) must be submitted via the relevant (supporting evidence) Moodle dropbox.
Note: This is the latest date we are allowed to give for handing in the assignment. No extensions beyond this date are possible.
Late Submission of Coursework
Coursework submitted after the published submission date without a valid Extenuating
Circumstances Form (ECF), but within ten working days of that date, will be marked. The mark awarded will be limited to the module pass mark (40% unless otherwise specified in the module handbook).
Coursework submitted more than ten working days after the published submission date will not be marked, and a mark of zero will be recorded on the student's record. It will be recorded as a non-submission.
Students are strongly advised to keep a copy of their work. Corruption of computer disks is not an adequate excuse for late hand in, as work should be adequately backed up.
Word Count
The coursework word count is a MAXIMUM OF 4,000 WORDS (THERE IS NO ±10% MARGIN) excluding reference list, bibliography, appendices, the cover page, abstract,
glossary and list of tables, figures, charts and abbreviation. Tables are expected to be primarily for the presentation of numerical data. Work that exceeds 4,000 words will not be read beyond the stated word count.
The word count should be stated at the top of your submission. A falsely stated word- count is an assessment offence, which will be referred to PBS Student Assessment and Assessment Regulations Lead.
2024-01-04