MDM4U Summative Task
Hello, dear friend, you can consult us at any time if you have any questions, add WeChat: daixieit
MDM4U Summative Task
Overall Expectations
A1. solve problems involving the probability of an event or a combination of events for discrete sample spaces.
A2. solve problems involving the application of permutations and combinations to determine the probability of an event.
B1. demonstrate an understanding of discrete probability distributions, represent them numerically, graphically, and algebraically, determine expected values, and solve related problems from a variety of applications.
B2. demonstrate an understanding of continuous probability distributions, make connections to discrete probability distributions, determine standard deviations, describe key features of the normal distribution, and solve related problems from a variety of applications.
C1. demonstrate an understanding of the role of data in statistical studies and the variability inherent in data, and distinguish different types of data.
C2. describe the characteristics of a good sample, some sampling techniques, and principles of primary data collection and collect and organize data to solve a problem.
D1. analyse, interpret, and draw conclusions from one-variable data using numerical and graphical summaries.D2. analyse, interpret, and draw conclusions from two-variable data using numerical, graphical, and algebraic summaries.
D3. demonstrate an understanding of the applications of data management used by the media and the advertising industry and in various occupations.
Instructions:
1. Create a probability game, do simulation, and complete a analysis report.
2. Files you need to submit:
• This instruction
• You game report
3. In this file, fill out the assessment table in Step 2, Step 7, and Self-Assessment Checklist. If
your teacher does not arrange partner, peer check, or class game day, ignore these parts. 4. Your score composes of two parts:
• Preparation (10%): Teacher will check the 3 tables and your report to exam whether you well thought out and prepared for this project. You can, but not required, also write brief explanation for each item.
• Report (90%): Reports with complex and clear game design, correct probability
calculation, adequate data collection, accurate result analysis and conclusion, correct math terms and expressions, clear organization, etc. will get higher scores.
5. Supplementary materials (Section 9.1, 9.2) are provided.
6. Requirements:
• Create your own game. Do not copy.
• You must create a game which can sufficiently demonstrate your understanding of
knowledge learned in Data Management and ability to solve relevant problems. Try to correctly apply and consider as much knowledge/methods/theories you learned as you can. Examples include, but are not limited to:
a. Counting, permutation and combination
b. Law of sum and law of product
c. Probability
d. Mutually exclusive and non-mutually exclusive events
e. Independent and dependent events
f. Discrete and continuous distributions
g. One-variable data analysis
h. Two-variable data analysis
i. Data collection, organization, bias, etc.
Full marks of Math Understanding will be considered for correctly applying at least 5 of the items.
• Content listed in the rubric and marking scheme must be included in your report. Use themasa guide to create the structure of your report.
• A clear and logical organization is required. Label the sections/tables/diagrams/charts clearly.
• Write a clear introduction. Imagine you area designer of a boardgame, and players will use your introduction to play your game independently. This is also a guide for yourself to do the experiment and calculation. Unclear description will lose marks.
• The experiment/analysis/calculation must be consistent with your introduction.
• When you simulate the game, sufficient trials are essential to calculate accurate
probabilities. Only doing 10 or 20 trials is not enough. Correspondingly, a well-designed data recording table is needed. Attach all the experimental data at the end of the report.
• Many ideas/theories can be examined in this game report. For example, you can play
the three rounds, with 40 trials in each round, then compare the results for each round. Also, you can play 40 trials, 100 trials, and 300 trials in each round, respectively, and analyze whether the experimental probability with more trials is closer to the theoretical one.
• Write the calculation in detail with explanations. Only showing the calculation without explanations will lose marks.
• Programming is allowed to do simulation, like Python, C, Java, etc. One advantage is that you can try alarge number of trials much easier, like 1000 or 3000 trials. If you use programming, attach your program and all the output clearly.
Step 1: Prepping for Game Construction
1. Create a mind map to brainstorm ideas about a game of chance you could create. Consider the games you investigated above, as well as any games discussed in class. Include details about how your data, calculations, and analysis might look.

2. Create a list of materials needed to construct your game.
3. Brainstorm the instructions for your game and how you will share them with players.
4. Decide on an appropriate payout structure for the winners.
5. What kind of data will your game generate? Design a chart you can use to record your data.
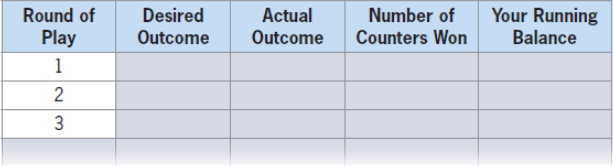
6. Simulate your game and record the data to test your instructions and data collection chart. Edit your instructions and chart if necessary.
7. Work with a partner to determine what probability calculations you can perform on the data generated. If you cannot calculate the theoretical probability of winning your game, you may need to change its structure. Does your game need to be
simplified? more complex?
easier to play? easier to track?
more fair to the players? more fair to you?
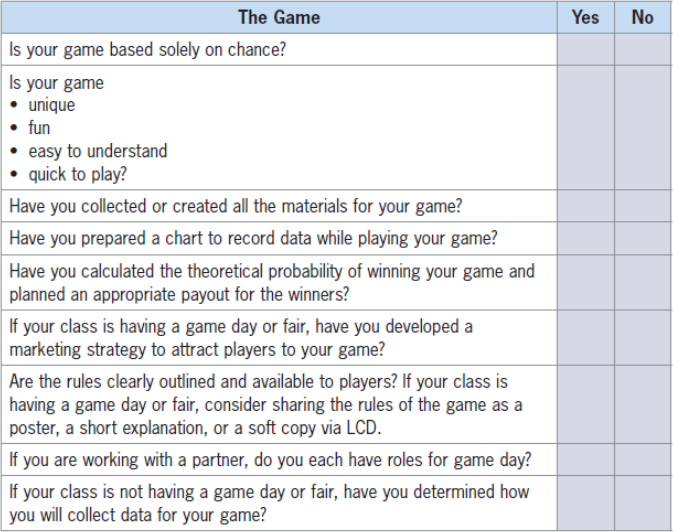
Step 2: Assessing Your Plan
Use the checklist to determine whether your game of chance plan is on track.
Step 3: Collecting Your Data
1. Collect data for your game, either on a game day or by playing or simulating your game multiple times.
2. Be sure to keep track of all outcomes and payouts.
Step 4: Planning Your Report
1. Are there any similarities between Kaelyn and Emma's game and your game of chance?
2. How might you represent the key elements of your analysis?
3. What graphs or charts could you use to represent data collected in your game?
4. What calculations could you include in your game of chance analysis? How will you show these calculations?
5. Would you make any adjustments to the payout structure in your game to ensure you win, or to make it more enticing for the player to continue playing?
6. What amount of data would you collect for your game of chance?
7. Could you use a random number generator to represent your data? If so, how many plays might you simulate? What results would you expect compared to the theoretical probability of winning your game, and to your experimental distribution if you simulated more rounds of play?
8. What would be an effective title for marketing your game of chance?
9. What elements of Kaelyn and Emma's game and analysis would you keep, change, or add to make a better game and report for your culminating probability project?
Step 5: Writing Your Report
A well-written report is organized, logical, and includes the necessary information with appropriate headings. Pull all the pieces together to tell the story of your game and its analysis in the form of a report. Your report should include
a description of the game, rules, and required materials
data from the game day or simulation
calculations of the theoretical distribution, experimental distribution, and expected value
comparison of the theoretical and experimental distributions
summary of conclusions, including discrepancies in the results and insights and reflections about the game
Step 6: Finalizing Your Project
1. Was a binomial distribution an appropriate choice to show the chances of winning from 0-5 times in five rounds?
2. Under what conditions does a binomial distribution model not work for this game?
3. Would another distribution model fit the data from this game better? Explain how you know.
4. What kind of distribution model might best fit the data from your game of chance? Include this information in your report and justify your calculations.
Step 7: Assessing Your Probability Project
Use the checklist to ensure your probability project is on track.

Assessing Your Culminating Probability Project
1. Use the Probability Project Self-Assessment Checklist to ensure you have included all relevant elements in your project.
2. Use the Probability Project Content Rubric to assess the depth and quality your report.
3. If you will be presenting your project to the class, consider recording your presentation on video and use the Probability Project Presentation Rubric to assess the quality of your presentation.
4. With a partner, brainstorm criteria for effective constructive feedback. Write a list of at least five tips to follow when providing feedback to a peer.
5. Trade projects with another peer or team. Use the Probability Project Self-Assessment Checklist and Probability Project Content Rubric to critique their work.
6. Use the Probability Project Peer Critique Form to provide written feedback. Keep in mind the criteria you brainstormed in #4 for effective feedback.
2024-01-03