COMPSCI 5089 Introduction to Data Science and Systems
Hello, dear friend, you can consult us at any time if you have any questions, add WeChat: daixieit
Introduction to Data Science and Systems
COMPSCI 5089
1. (a) You are designing an application for clothing shops to predict clothes size based on customer height and weight. Suppose we have a clothing dataset with height, weight and the corresponding T-shirt size of several customers.
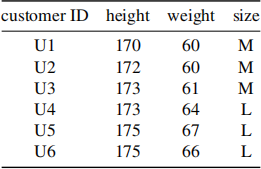
You can represent this dataset based on their vector representations by regarding height and weight as two dimensions. Now there is a new client Abel (U0) whose height is 173cm and weight is 62kg. You are asked to predict the T-shirt size for Abel.
(i) Calculate the Euclidean distance (L2 Norm) between the new point and the existing points. [3]
(ii) Predict the size of Abel, based on the kNN algorithm, with k = 3 and the above calculated distances. Justify your prediction. [2]
(b) For all answers, include in your answer document both code and the output of that code.
(i) Calculate the covariance matrix for the clothing dataset using numpy. [1]
(ii) Calculate the eigenvector and eigenvalues the covariance matrix using numpy. [2]
(iii) Dimensionality reduction. Map the clothing dataset into principal component with the largest eigenvalue of its covariance matrix. [2]
(c) (i) Find SVD for 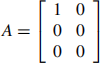 , you should include full working in your solution. [3]
(ii) State the relations between determinant, matrix inversion and non-singular. [2]
2. Consider a tennis player, Ed Balls, who wants to prepare for a competition match against an opponent—let’s call him Frank Racket. In order to prepare for the match, Ed has acquired records of the 100 previous matches of his opponent and wants to study statistics of Frank’s play to choose where to focus his training.
(Here is a quick summary of the rules of tennis: https://protennistips.net/tennis-rules/)
Ed is interested in studying Frank’s serve as this can be an important strategic advantage.
• For a serve to be valid, it must pass the net and bounce in the diagonally opposite service box.
• If the first serve is a fault (eg, hits the net or bounces outside the service box), the player can attempt a second serve.
• If the player makes a second fault, he loses the point.
Ed wants to study where Frank’s serve bounce in the service box to plan his positioning on the court. We have NF = 1,000 examples of first serve from Frank, and NS = 1,000 examples of second serve. We want to estimate the distributions of the bounce location x for Frank’s first p(x| first) and second serves p(x|second).
For simplicity,
• we denote the corner closer to the net and towards the centre of the court as position (0,0), and the corner towards the outside of the court and away from the net as (1,1).
• We will ignore serves that hit the net
This means that values outside [0,1]×[0,1] indicate that the serve is a fault.
(a) How would you use the empirical distribution to get an estimate of p(x| first) ? Explain the steps, the parameters that need to be set and the associated trade-offs. [4]
(b) Ed now wants to model Frank’s serves using a normal distribution:
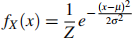
(i) Explain the parameters, their effect on the distribution and the best way to estimate them in this scenario. [4]
(ii) What could be the problem with this choice of model? Give an example of a situation where it would be inappropriate (you can use a diagram to illustrate your example). [2]
(c) Ed has found that his normal model is not accurate enough for him. In order to get a more accurate modelling of the data, he decides to use a mixture of Gaussians to model his data.
Explain how the model would be parameterised, and how you would fit the model to the available data (provide the relevant equations). [5]
3. Pretend that you are the new head of a local radio, IDSS Radio being tasked with renewing the radio’s image and programme. The radio’s programming and popularity has varied over the years and you want to use a data science approach to find the right type of programming for the local audience. To this end you start by categorising the programming of the radio between types of content:

You have historical records of the proportion of each content type in the radio programme for every month over the last ten years, as well as a rating r by a sample of the audience on scale between 1 and 10, where 1 means “hate it” and 10 means “love it”.
Considering a programme p = [pm, pn, pb, pf , pc, pa] ∈ R 5 that gives the number of hours for each content type, we are interested in studying the function r(p) that gives the listeners’ rating for this programme.
(a) As a first attempt, you decide to assume that the function r(p) is linear, and therefore to solve it using linear-least-squares, of the canonical form (from the lecture notes):

(i) Explain what each variable in this equation means in this scenario, specifying their dimension, and what would be the result. [4]
(ii) Could you name a reason why this may not be a good model? How could you measure this using your data? [3]
(b) We want to try and fit another model, this time assuming that viewers’ preferences peak for certain quantities of each program, and then decreases again if the quantity increases even more. We could model this quantity preference as a bell shaped distribution function over the quantity pz for each type of content z:

and the overall predicetd preference for a program p as:
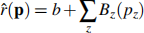
(i) How many parameters do you need to estimate in this case? Explain the role of each parameter. [3]
(ii) What would be the most appropriate approach to fit this model to your data (Note: all of the functions above are differentiable, but Bc is clearly not linear)? Explain how you would parametrise this problem (you are not asked to solve it!) [3]
(c) Using this model rˆ, how would you use optimisation to find the best program, knowing that you want to run the radio from 6am to midnight daily, and need at least 1 hour of advertisement per day to cover the radio running costs. How would you resolve this optimisation? [2]
4. (a) Consider a relation Weather(Id, Time, Longitude, Latitude, Temperature, Humidity), where the primary key (Id) is a 116-byte string hash code, Time is 8-byte Datetime, the other fields are stored by 32-bit float. Assume that the relation has 30000 tuples, stored in a file on disk organised in 4096-byte blocks. Note that the database system adopts fixed-length records – i.e., each file record corresponds to one tuple of the relation and vice versa.
(i) Compute the blocking factor and the number of blocks required to store this relation. [2]
(ii) You are told that you will need to frequently add new records and you will not often read and fetch a record. Describe in detail the file organisation that you would expect to exhibit the best performance characteristics. Explain your answer by comparing the cost of reasonable alternatives. [3]
(b) Consider the following three relations:
• Student(Id, FirstName, LastName, DateOfBirth) where
– the primary key (Id) is a 32-bit integer,
– FirstName and LastName are both 96-byte strings, and
– DateOfBirth is a 32-bit Integer.
• Course(Id, Description, Credits), or C, where:
– Id, the primary key of this relation, is a 32-bit integer,
– Description is a 195-byte string, and
– Credits is an 8-bit integer.
• Transcript(StudentId, CourseId, Mark), or T , where:
– StudentId is a foreign key to the primary key (Id) in the Student relation,
– CourseId is a foreign key to the primary key (Id) in the Course relation above
– Mark is a 8-byte double precision floating number, and
– the primary key consists of the combination of StudentID and CourseID.
Assume these relations are also organised in 4096-byte blocks, and that:
• Relation Course (C) has rC = 32 records and nC = 2 blocks, organised in a heap file,
• Relation Transcript (T ) has rT = 51200 records and nT = 200 blocks, organised in a sequential file, ordered by StudentID.
• Relation Student (S) has rS = 2000 records and nS =100 blocks, stored in a heap file and has a 4-level secondary index on StudentId.
Further assume that the memory of the database system can accommodate nB = 23 blocks for processing and that the blocking factor for the join-results block is b f rRS = 10 records per block.
Last, assume we execute the following equi-join query:
SELECT * FROM Transcript AS T, Student AS S, Course AS C
WHERE T.StudentId = S.Id AND T.CourseId = Course.Id
As this is a 3-way join, assume that you need to join T with C first, with each block of intermediate results stored only in RAM (in one of the nB blocks), then joined with S.
(i) Describe the join strategy that would be the most efficient in this case and estimate its total expected cost (in number of block accesses). Show your work. [8]
(ii) Compare the Naive Nested Loop Join and the Index-based Nested-Loop Join. Which one is faster? Explain why. [2]
2023-12-29