Spring 2023 STAT 240 Final Exam
Hello, dear friend, you can consult us at any time if you have any questions, add WeChat: daixieit
Spring 2023 STAT 240 Final Exam
Multiple Choice. (4 points each)
Problem 1. Which ggplot2 geom_*() functions can you use to visualize the center, spread, and skewness of a single quantitative variable? Circle all answers which apply and cross out those that do not.
(a) geom_bar() (b) geom_boxplot() (c) geom_density() (d) geom_histogram()
Problem 2. The data set mendota has one row for each winter and includes a quantitative variable duration, the number of days the lake was closed with ice. Which command keeps rows with duration less than 100? Circle one answer.
(a) mendota %>% filter(duration < 100)
(b) mendota %>% mutate(duration < 100)
(c) mendota %>% select(duration < 100)
(d) mendota %>% slice(duration < 100)
Problem 3. Which lubridate command will convert the string “07-May-2023” into the date May 7, 2023? Circle one answer.
(a) as_date() (b) date() (c) dmy() (d) mdy()
Problem 4. A data set named mw with daily official Madison weather records has a quantitative variable named snow which stores daily snowfall values in inches, a column date with the date, and columns year and month with the year and month values, respectively, of the date. We wish to make a data summary with the total number of days with daily snowfall more than one inch for each month and year. Partial code for this task is displayed here.
prob4 = mw %>% drop_na(snow) %>% XXX %>% summarize(total = sum(snow > 1))
What code should replace XXX to complete this task? Circle one answer.
(a) distinct(year, month)
(b) group_by(date, year, month)
(c) group_by(year, month)
(d) pivot_longer(names_to = year, values_to = month)
Problem 5. A data frame wrdl contains a single column named word which contains five letter English words which are solutions to the game Wordle. Which commands will filter the data frame, retaining only rows where the word begins with the letter “s”, ends with the letter “e”, and contains at least one letter “a” which is not the third letter of the word. Circle all correct answers and cross out all incorrect answers.
(a) wrdl %>% filter(str_detect(word, "s.[ˆa].e"))
(b) wrdl %>% filter(str_detect(word, "a+") & str_detect(word, "ˆs.{3}e$"))
(c) wrdl %>% filter(str_detect(word, "ˆs.[ˆa].e$") & str_detect(word, "a"))
(d) wrdl %>% filter(str_detect(word, "ˆs.*a.*e$") & str_sub(word, 3, 3) != "a")
Problem 6. Which R expression is most appropriate to calculate the numerical value a for a 99% confidence interval for a population mean µ of the form ¯x ± aSE(¯x) from a sample of n = 15 observations. Circle one answer.
(a) qnorm(0.99) (b) qt(0.99, 14) (c) qt(0.99, 15) (d) qt(0.995, 14) (e) qt(0.995, 15)
Problem 7. In a fitted regression model of y on x, identify possible values for the predicted value yˆ when x = 0 and we have the following summary statistics: ¯x = 10, y¯ = 50, sx = 5, and sy = 10.
Circle all correct answers and cross out incorrect answers.
(a) 0 (b) 20 (c) 50 (d) 70 (e) 100
Problem 8. A random variable X is generated by taking random samples of 100 men and 100 women who completed the Boston marathon in 2010 and counting the total number (combined men and women) who finished in less than 180 minutes.
If X has a binomial distribution, circle (a) and cross out all other answers. If X does not have a binomial distribution, cross out (a) and circle all correct statements and cross out all incorrect statements about why it is not binomial.
(a) X has a binomial distribution
(b) X is not binomial because there are not a fixed number of trials
(c) X is not binomial because the trials are not independent of each other
(d) X is not binomial because the probabilities of success are the not same for each trial.
Problem 9. How do the numerical values of qnorm(0.975) and qt(0.975, 10) compare? Circle one answer.
(a) the first is smaller (b) they are equal (c) the first is larger (d) this cannot be determined
Problem 10. When conducting a two-sided hypothesis test for a population proportion with the null hypothesis H0 : p = 0.5 using a binomial test, the sample estimate is pˆ = 0.61 and we obtain a p-value equal to 0.002. Circle all correct answers and cross out incorrect answers.
(a) Using the same data, a 95% confidence interval for p would include the value 0.5.
(b) The hypothesis test is statistically significant at the α = 0.05 level.
(c) If p was the probability of making a pro-social choice in an experimental setting, we would have strong evidence that this probability is greater than 0.5.
(d) There is very strong evidence that p is exactly equal to 0.5.
(e) There is very strong evidence that p is exactly equal to 0.61.
Problem 11 (16 points)
In an audioology research experiment, a single subject with normal hearing was tested in the following manner. The subject heard a spoken word once and then selected the word they thought they heard from a list of four similar sounding words. This process was repeated for 100 different words. Assume that it is reasonable to model the number of correct responses with a binomial distribution. The same subject was then re-tested while wearing headphones playing background noise to simulate severe hearing loss after inner ear damage. In normal conditions, the subject named the correct word 63 times out of 100. With simulated hearing loss, the subject was correct 16 times out of 100.
(a) Do the following steps to conduct a two-sided hypothesis test for the difference in probabilities of naming the correct word:
1. define parameters p1 and p2;
2. state null and alternative hypotheses;
3. using some of the variables defined below, write an R expression to calculate the value of the test statistic for this hypothesis test using the recommended method from the course. Many values are not needed.
p1a = 63/100; p1b = 64/102; p1c = 65/104
p2a = 16/100; p2b = 17/102; p2c = 18/104
p3 = (63+16)/(100+100)
4. write a small R expression which would calculate the p-value for this test assuming that the numerical value of the test statistic is 6.798.
(b) Assume that the calculated p-value is smaller than 10−10. Write an interpretation of the hypothesis test you conducted in the previous problem in plain language, referencing statistical evidence to support your conclusion in parentheses, similar to examples from the course.
Problem 12 (10 points)
(a) Using the data from Problem 11 use the Agresti-Coull method to construct a 95% confidence interval for the probability that the subject is correct when hearing a single word when simulating severe hearing loss. Using some of the variables defined in the previous problem, write R expressions to calculate the end points of the confidence interval, including:
• the center of the confidence interval;
• the standard error;
• the critical value multiplier; and
• the margin of error
(b) Provide an interpretation in context for this confidence interval assuming that the numerical end points of the interval are 0.100 and 0.246.
Problem 13 (9 points) A 1972 breast cancer study included multiple numerical measurements of tumors. Each tumor is classified as benign or malignant. The variable clump_thickness is measured on a scale from 1 to 10 with 1 the smallest and 10 the largest. We are interested in inference comparing the mean population tumor sizes for these two classes of tumors.
This table contains summary statistics.
class n mean sd
benign 457 2.952 1.673
malignant 241 7.195 2.429
Here is the R output of the t.test() function for this data.
t.test(benign, malignant)
##
## Welch Two Sample t-test
##
## data: benign and malignant
## t = -24.254, df = 363.22, p-value < 2.2e-16
## alternative hypothesis: true difference in means is not equal to 0
## 95 percent confidence interval:
## -4.587195 -3.899127
## sample estimates:
## mean of x mean of y
## 2.951860 7.195021
(a) 1. Write an expression which calculates the test statistic of the hypothesis test from the summary table. 2. Identify the numerical value of this test statistic from the R output.
(b) Circle all valid statements assuming that the data are represented samples from populations of interest.
A. There is strong evidence that the population mean clump thicknesses of benign and malignant tumors are the same size.
B. There is strong evidence that the population mean clump thicknesses of benign tumors are smaller than that of malignant tumors.
C. The hypothesis test is statistically significant at the α = 0.05 level of significance.
(c) Write an expression to calculate the margin of error of the 95% confidence interval from the summary data, indicating with an R expression how you would find the critical t-value.
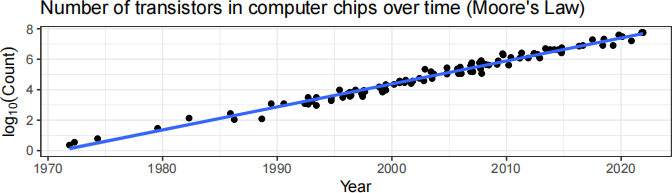
Problem 14 (15 points) Moore’s law says that the number of transistors in computer chips doubles about every two years. The following plot shows the base-10 log # of computer chips versus year for a sample of 99 chips.
Here are brief summaries of the fitted regression line.
coef(summary(moore_lm))
## Estimate Std. Error t value Pr(>|t|)
## (Intercept) -297.4079603 4.417131748 -67.33056 3.075029e-83
## year 0.1508932 0.002204463 68.44896 6.427108e-84
sigma(moore_lm)
## [1] 0.2355777
(a) Circle the value closest to the correlation coefficient between the base-10 log count of the number of transistors and the year.
−5 − 0.99 0 0.2 0.6 0.99 1 1.3
(b) If Moore’s law is correct, then the relationship between the number of transistors in a computer chip (T) and year (Y ) would be T = C2
Y /2
for some constant C. After taking logs on both sides, this simplifies to 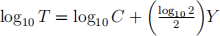 , where the slope coefficient before Y has the numerical value log10(2)/2 = 0.1505.
Write an expression for the test statistic to test Moore’s Law using numbers when possible. Do not simplify your expression.
(c) Assume that the value of this test statistic is 0.1716. Write an R expression to calculate the p-value for a two-sided hypothesis test.
(d) Assume that the p-value is equal to 0.86. Write a conclusion of this hypothesis test following the style presented in class. (Plain language summary followed by statistical evidence in parentheses.)
Problem 15 (13 points)
This problem also uses the Moore’s Law data from the previous problem. Let x be the Year, y be the base-10 log of the number of transistors, and ˆσ be the estimate residual standard deviation.
(a) Match the numbers 0.236, 1.6, 4.9, 10.8, 2004 to the following quantities by writing the numerical values below the corresponding expressions.
¯x SD(x) ¯y SD(y) ˆσ
(b) Consider the years 2004 and 2025 and confidence intervals for the expected base-10 log count of the number of transistors in those years and prediction intervals for the value of the number of transistors in a single computer chip chosen at random in each of those years. Each confidence or prediction interval will be centered at the value on the regression line and have a margin of error/prediction error equal to some value. The following six values include two interval centers and four margins of error.
0.0470 0.105 0.468 0.479 4.98 8.15
Write expressions for each of the confidence and prediction intervals using these values. (Use the form number ± number.) Do not simplify the expressions.
95% confidence interval for E(ˆy | x = 2004)
95% prediction interval for predicted value y* when x = 2004
95% confidence interval for E(ˆy | x = 2025)
95% prediction interval for predicted value y* when x = 2025
2023-12-23