MIDTERM SAMPLE PROBLEMS 2021
Hello, dear friend, you can consult us at any time if you have any questions, add WeChat: daixieit
MIDTERM SAMPLE PROBLEMS
Please note the Zt in the following is the same as wt, namely these are white noises.
• 1. What are the model assumptions of ARIMA(p,q) model?
1.
2.
3.
4.
2. Explain the following terms briefly
1. Weak stationarity.
2. White noise.
3. Sample autocorrelation function.
4. The if and only if conditions for the invertibility of the MA(q) process.
3. (1) Suppose that {Yt} is stationary with autocovariance function γk. Show that Wt = Yt − Yt−1 is stationary.
(2) Suppose Yt = β0+β1t+Xt where {Xt} is a zero-mean stationary series with autocovariance function γk and β0 and β1 are constants. Show that {Yt} is not stationary but that Wt = Yt − Yt−1 is stationary.
4. (1) Consider the process: Wt = 0.8Wt−1 + et − 0.3θet−1 where Wt = Yt − Yt−1. What kind of model is it? Find the variance of the process {Wt}. (2) Find the autocorrelation for {Wt}.
• Problem A
1. State whether the following model is stationary, and whether it is invertible. Explain why.
Xt = Zt − 1.5Zt−1 + 0.5Zt−2
2. We perform ARMA analysis on a time series Xt . The following are the outputs of the ARMA model.
ar1 ma1
0.2569 -0.9302
s.e. 0.0787 0.0361
(a) Write down the estimated model for Xt .
(b) Write down the AR and MA polynomials of the model.
3. Obtain all non-zero serial correlations ρ(h) of the model Xt = (1 − 0.2B)(1 − 0.3B2)Zt where Zt is i.i.d. normal with mean zero and variance 3. Show your computation steps.
4. Suppose the monthly simple returns of a portfolio for Oct., Nov., and Dec. of 2011 were 0.04, 0.03, and -0.02 respectively. What is the quarterly log return of the portfolio for last quarter of 2011? What is the quarterly simple return of the portfolio for last quarter of 2011?
1. First we look at the outputs of simple statistics calculated for sp500 daily log returns.
Answer the next two questions:
> basicStats(sp500.logreturn)
sp500.logreturn
nobs 1528.000000
NAs 0.000000
Minimum -0.094695
Maximum 0.109572
1. Quartile -0.005430
3. Quartile 0.006319
Mean 0.000024
Median 0.000857
Sum 0.036776
SE Mean 0.000396
LCL Mean -0.000753
UCL Mean 0.000801
Variance 0.000240
Stdev 0.015485
Skewness -0.276724
Kurtosis 7.927383
(a) Based on the output, is the mean of the log return significantly different from zero at 5% level? Write down the test-statistics and draw conclusion. Z0.025 = 1.96, Z0.05 = 1.65?
(b) Which statistics in the output is usually used for checking if the log return is heavy tailed? Write down the numerical value of that statistics.
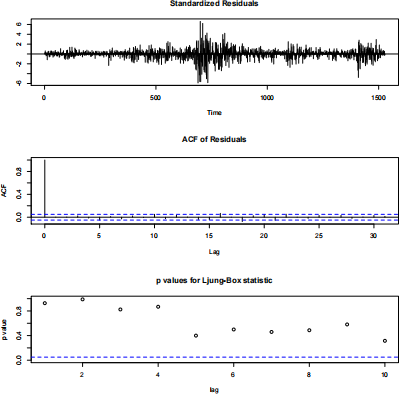
2. Next we fit an AR(2) model to the data. Judging from the tsdiag plot of the model, is the model adequate? Why? Pay special attention to the first plot.
> model1=arima(sp500.logreturn ,order=c(2,0,0))
> tsdiag(model1)
• Problem C
Consider the AR(2) model
Xt = 0.02 + 0.7Xt−1 − 0.1Xt−2 + Zt ,
where Zt is normal with mean 0 and variance 2.
1. What is E(Xt)?
2. What is the AR polynomial for this model? What are the roots of the polynomial?
2023-12-23
Time series modeling