CS345/912 Sensor Networks and Mobile Data Communications Term 1, 2023-2024
Hello, dear friend, you can consult us at any time if you have any questions, add WeChat: daixieit
CS345/912 Sensor Networks and Mobile Data Communications
Term 1, 2023-2024
Coursework Specification
I. Introduction
Two villages 10 kilometres apart communicate through a Delay Tolerant Network (DTN). Village 1, which has the transceiver Node 0, sends packets to transceiver Node 1. Node 1 is located in a bus that travels to the vicinity of Village 2, where it will transfer the packets to transceiver Node 2. The position of all nodes is depicted in Fig. 1, where d = 3 m.
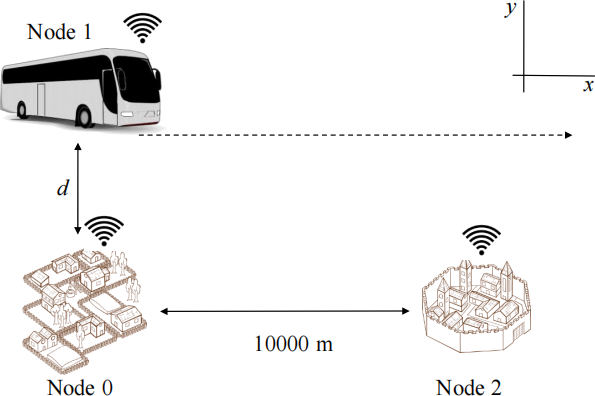
Fig. 1. Initial position of nodes
Node operation
Village 1 - Node 0
Several readings are generated by Node 0 at a rate of 1 reading per second. These readings are stamped with the order in which they are generated and stored in a buffer. The elements in the buffer are represented in the simulation by two variables: head and tail. The buffer in Node 0 can only accommodate three readings; when the buffer is full, the oldest reading in the buffer is thrown away. Assuming no data is transmitted to Node 1, the contents of Node 0’s buffer change as tabulated in Table 1.
Table 1. Contents of Node 0’s buffer assuming no data transmission.
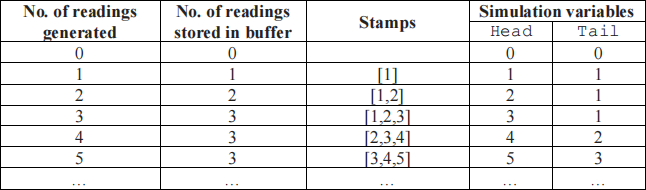
As long as the buffer is not empty, Node 0 encapsulates the buffer’s contents into a packet and transmits it to Node 1 at the rate of 4 packets per second. Upon receiving an acknowledgement from Node 1, Node 0 clears the contents of its buffer.
The bus - Node 1
After receiving a data packet from Node 0, Node 1 stores the contents of the packet into its buffer, and then acknowledges the reception of the packet. After acknowledging the packet, Node 1 repeatedly transmits data packets to Node 2 at the rate of 4 packets per second. Node 1 also encapsulates its buffer into a packet. Node 1 only stops transmitting a data packet upon receiving an acknowledgement from Node 2. Note, however, that Node 1’s buffer can change before it can successfully send a packet to Node 2. This will happen for instance when it receives a new packet from Node 0.
Village 2- Node 2
Upon receiving a data packet from Node 1, Node 2 sends an acknowledgement.
II. Methods
Use code CS345_BASE_2023.cc, which is available on the module webpage, to complete this coursework. The bus as simulated in the code does not move. You can verify this by running the code: it is only the bus and Village 1 that interact.
a. Introduce a mobility model such that Node 1 moves at a constant speed of 20m/s. Make sure that the bus moves in a straight line up to the x-coordinate of Village 2 (Node 1 should stop once it reaches this destination). After implementing the mobility of the bus, make sure that all nodes interact according to the behaviour described before. [15 marks]
b. Determine the transmission range of Village 1 and Village 2 and the region where the bus can receive/transmit to both villages (if any). When running your simulations, make sure that the duration of the simulation is long enough for Node 1 to move to the same x-coordinate as that of Node 2. [5 marks]
c. Modify the code so that every time Node 2 receives a unique packet, it also prints the number of readings received so far. [5 marks]
d. Plot the relationship between the speed of Node 1, distance d, and the number of readings received by Node 2. To this end, test a speed from 20m/s to 200m/s (increments of 10m/s) and a distance d from 3m to 303m (increments of 6 m). Note that this relationship can be plotted in different ways, e.g., line plots or 3D plots. How does the speed of Node 1 and distance d affect the number of readings received by Node 2? Explain. [10 marks]
e. Modify the behaviour of Node 1 so that it keeps all received readings in its buffer. For example:
Node 1’s current buffer: [1, 2, 3]
EVENT: data packet is received by Node 1 with readings [4, 5, 6]
Node 1’s new buffer: [1, 2, 3, 4, 5, 6] [10 marks]
f. Repeat the experiment in II.d, but this time using the modified code from II.e. Plot the relationship between the speed of Node 1, distance d, and the number of readings received by Node 2. Explain any differences with the plot obtained in II.d. [5 marks]
g. Add a mobile node (Node 3) to the DTN. This additional node must be initially located to the left of Node 1 at a distance d2 = 250 m (see Fig. 3). Node 3 must have the same y-coordinate and speed as those of Node 1. Node 3 must have the same behaviour as that of Node 1 (after all previous modifications introduced); i.e., it should be able to receive packets from Node 0 and transmit packets to Node 2.

Fig. 3. Initial position of nodes with additional node.
Note that by adding Node 3 to the DTN, the following aspects should be considered:
• Node 0 is originally hard-coded to transmit exclusively to Node 1. You should modify Node 0’s behaviour so that it can transmit (broadcast) to both Node 1 and Node 3. Hint: you may use the method SetAllowBroadcast.
• Node 2 should be able to receive data packets from Node 1 and Node 3. Node 2 must be able to properly count the number of readings received. It is possible for the readings transmitted by Node 1 and Node 3 to overlap. For example, Node 1 may transmit readings 1-6, while Node 3 may transmit readings 4-7. The total number of received readings, in this case, is 7; i.e., [1, 2, 3, 4, 5, 6, 7]. It is also possible for Node 1 and Node 3 to transmit different readings. For example, Node 1 may transmit readings 1-6, while Node 3 may transmit readings 10- 12. The total number of received readings in this case is 9; i.e., [1, 2, 3, 4, 5, 6, 10, 11, 12]. Node 2 must be able to deal with both cases properly. [30 marks]
h. Plot the relationship between distance d2, as depicted in Fig. 3, distance d, and the total number of readings received by Node 2. Set the speed of Node 1 and Node 3 to 20m/s. Test distance d from 3m to 303m (increments of 6 m). Test distance d2 from 50m to 1000m (increments of 50 m). When running your simulations, make sure that the duration of the simulation is long enough for Node 3 to move to the same x- coordinate as that of Node 2. Explain and discuss any differences in the plot compared to the one obtained in II.f for a speed of 20m/s. [10 marks]
III. Deliverables
Submit the following via Tabula:
1. A report with a description of how the DTN was modified according to each subsection of Section II, as well as the requested explanations, discussions, and plots. Make sure to include snippets of code showing your modifications to the code. Cleary explain these modifications.
2. Your final solution for II.g as a cc file. Please make sure that the submitted code compiles and works correctly before submitting.
A total of 10 marks are available for the quality and presentation of reports, as well as the organization and explanation of your code (comment your code appropriately to indicate the changes made). Documents should be clearly and logically structured, well-written, and adequately proof-read before submission. The suggested length is between 1600- 1800 words. The standard department late penalties and plagiarism policies are in effect.
2023-12-21