UCL-ELEC0136: Data Acquisition and Processing Systems
Hello, dear friend, you can consult us at any time if you have any questions, add WeChat: daixieit
UCL-ELEC0136: Data Acquisition and Processing Systems
Final Assignment
Submission deadline: Please check the Moodle page of the course.
1 Objectives
The objective of this assignment is to simulate a real-life data science scenario that aligns with the process discussed in class. This process involves:
1. Finding and acquiring a source of data.
2. Storing the acquired data.
3. Cleaning and pre-processing the data.
4. Extracting meaningful visualizations.
5. Building a model for inference.
You are encouraged to utilize any additional methods you deem suitable for solving the problem. The assignment comprises two main deliverables:
1. A written report presented in the format of an academic paper.
2. The accompanying codebase to support your report.
While exchanging ideas and discussing the assignment with your peers is allowed, it is essential to emphasize that your code, experiments, and report must be the result of your individual effort.
2 Overview
Assume you are a junior Data Scientist at Money, a UK investment company and your project manager, Melanie, provides you with the following list of public companies:
. Apple Inc. (AAPL),
. Microsoft Corp. (MSFT),
. American Airlines Group Inc (AAL),
. Zoom Video Communication Inc (ZM)
You must select ONE of these companies and study their market trends to ultimately be able to advise on when and whether Money should (I) buy, (II) hold, or (III) sell this stock.
Melanie asked you to follow the company guidelines, which advise this process:
1. Select a company and acquire stock data from the beginning of April 2019 up to the end of March 2023.
2. Collect any other data on external events (e.g., seasonal trends, world news etc.) that might have an impact on the company’s stocks.
3. Choose the storing strategy that most efficiently supports the upcoming data analysis.
4. Check for any missing/noisy/outlier data, and clean it, only if necessary.
5. Process the data, extracting features that you believe are meaningful to forecast the trend of the stock.
6. Provide useful visualisations of the data, exploiting patterns you might find.
7. Train a model to predict the closing stock price.
Details for each task are provided in Section 2. Details of how each task is marked are included in Section 3.
3 Task Details
[IMPORTANT NOTE] Tasks 1.2, 2.2, 4.2 and 6 are more advanced, but based on the scoring criteria provided in Section 5, you can pass this assignment without solving these tasks. However, you would need to solve these to achieve a top-distinction range.
The percentage provided on each task description is the weight of the mark in the 70% of the report, as clearly defined in Section 5.
Task 1: Data Acquisition
You will first have to acquire the necessary data to conduct your study.
Task 1.1 [5%] One essential type of data that you will need is the stock prices for the company you have chosen, spanning from the 1st of April 2019 to the 31st of March 2023, as described in Section 1. Since these companies are public, the data is made available online. We note that any data sources are to be accessed exclusively through a web API rather than downloading files manually. The first task is to search and collect stock prices, finding the best way to access and acquire it through a web API.
Task 1.2 [7%] Search and collect more/different data relevant to this task. There are many valuable sources of information for analysing the stock market. In addition to time series depicting the evolution of stock prices, acquire auxiliary data that is likely to be useful for the forecast, such as:
1. Social Media, e.g., Twitter: This can be used to understand the public’s sentiment towards the stock market;
2. Financial reports: This can help explain what kind of factors are likely to affect the stock market the most;
3. News: This can be used to draw links between current affairs and the stock market;
4. Meteorological data: Sometimes climate or weather data is directly correlated to some companies’
stock prices and should therefore be taken into account in financial analysis;
5. Others: anything that can justifiably support your analysis.
Remember, you are looking for historical data, not live data, and that any data sources must be accessed through a web API rather than downloading files manually.
Task 2: Data Storage
Once you have found a way to acquire the relevant data, you need to decide on how to store it.
Task 2.1 [6%] You should choose a format that allows efficient read access to allow training a parametric model. The data corpus should also be such that it can be easily inspected. If you wish to use databases, these should be web-hosted (i.e., not local), such as a Mongo Atlas instance. You MUST include your credentials in the code and do not worry about security issues. Instead, if you wish to not use databases, data can be stored locally (e.g. in .csv, .npz, or .pkl format). However, storing data locally will result in a lower mark for this task, and prevent you from completing Task 2.2.
Task 2.2 [4%] For this task, you need to have your data stored in a web-hosted database.
Create a simple API to allow Melanie to contribute and analyse the data you collected. The API must implement the CRUD protocol and be accessible from the web. The CRUD functions must have the following signature:
. The create function create(database, item: Any) -> bool must take an item, insert it in the database and return a Boolean indicating whether the creation is successful.
. The read function read(database, query: str) -> Any must return all the items matching a specific query.
. The update function update(database, item: Any, properties: Dict) -> bool must take an existing item, update its properties accordingly and return a Boolean indicating whether the item has been successfully updated. The dictionary properties contains the name-value pairs of the properties to update.
. The delete function delete(database, id: str) -> bool must remove the item with id id from the database and return a Boolean indicating whether the deletion is successful.
Task 3: Data Preprocessing
Now that you have the data stored, you can start preprocessing it. Think about what features to keep, and which ones to transform, combine or discard. Make sure your data is clean and consistent. You are expected to:
Task 3.1 [5%] Check the data for missing values and outliers in the time series. Clean the data from missing values and outliers.
Task 3.2 [5%] Using plots, provide useful visualisations of the data and the operations you performed and discuss the insights that can be derived from the produced visualisations. Make sure to save the plots as additional separate files.
Task 3.3 [5%] Transform your data (e.g., using normalization, dimensionality reduction, etc.) to improve the forecasting performance.
Task 4: Data Exploration
After ensuring that the data is well preprocessed, it is time to explore the data, make hypotheses and develop insights about possible patterns in it. Depending on the data, different exploratory data analysis (EDA) techniques can be applied, and a large amount of information can be extracted.
Task 4.1 [8%] Perform exploratory data analysis on your data. Provide key insights into the data. Tip: Given that time series data typically comprises multiple components, you can perform the following analysis as an example:
. The trend represents the overall tendency of the data to increase or decrease overtime.
. Seasonality is related to the presence of recurrent patterns that appear after regular intervals (like seasons).
. Random noise is often hard to explain and represents all those changes in the data that seem unex- pected. Sometimes sudden changes are related to fixed or predictable events (e.g., public holidays).
. Feature correlations provide additional insight into the data structure. Scatter plots and box plots are useful tools to spot relevant information.
. Explain potential causes of unusual behaviour.
. Explore the correlation between stock price data and other external data that you can collect.
. Use hypothesis testing to better understand the composition of your dataset and its representative- ness.
Task 4.2 [5%] Calculate some of the known financial indicators for stock data. You can find a list of the most common indicators here. Then, plot and describe the indicators that you calculated. Use the indicators to derive insights about the stock trends, and identify the most significant days that it could be convenient to sell or buy stocks.
[IMPORTANT NOTE] Tasks 4.1 and 4.2 should inform the subsequent data analysis/inference pro- cedure, allowing one to establish a predictive relationship between variables.
Task 5: Forecasting
In this task, you will train two models with the aim of forecasting the stock prices from the 1st of April 2023 to the 30th of April 2023. You will use the data that you have already collected, stored, preprocessed and explored from previous steps. In particular:
Task 5.1 [3%] Develop ONE model that takes the previous n stock movements as inputs and outputs the closing price of the next day. Choose n appropriately, justify the choice, and use the model recursively to predict the true closing price for each day from the 1st of April 2023 to the 30th of April 2023 (the evaluation period). For example, if we assume n = 2, to predict the closing price of the 3rd of April the model takes the prices from the 2nd and the 1st of April. However, since these days are within the evaluation window, we must consider them not available, and we must forecast them as well. Evaluate the model on the true closing price of each day from 1st April 2023 to the 30th of April 2023.
Task 5.2 [4%] If you acquired auxiliary data, apply the same schema to develop ONE model that takes the previous n stock movements and the auxiliary data in the previous n days and outputs the closing price of the next day. Choose n appropriately, justify the choice, and evaluate the model on the true closing price of each day from the 1st of April 2023 to the 30th of April 2023. Notice that, for this task, the auxiliary data from the 1st of April 2023 to the 30th of April 2023 (the evaluation period) is also missing, in addition to stock prices. For this reason, you must also train an auxiliary model that forecasts auxiliary data.
[IMPORTANT NOTE] During training, make sure that all data is historical (i.e., ensure that you do not use stock data or auxiliary data from the month you are predicting).
Task 5.3 [3%] Report the results in an appropriate format of your choice and discuss the performance of these models. In particular:
1. Which model is performing better?
2. How do you measure performance and why?
3. How could you further improve the performance?
4. Are the models capable of predicting the closing stock prices far into the future?
[IMPORTANT NOTE] For these tasks, you are NOT being asked to compare model architec- tures. Instead, your task is to examine and analyse the differences when training the same model with multiple data attributes and information from sources. Therefore, you should decide on a single model suitable for time series data to solve the tasks described above. Please see the lecture slides for tips on model selection and feel free to experiment before selecting one.
The following guide will help you evaluate your approach and highlight potential weaknesses in your process:
1. Evaluate the performance of your model using different metrics, e.g. mean squared error, mean absolute error or R-squared.
2. Use ARIMA to explore the uncertainty of your model’s predicted values by employing confidence bands.
3. Results visualisation: create joint plots showing marginal distributions to understand the correlation between actual and predicted values.
4. Finding the mean, median and skewness of the residual distribution might provide additional insight into the predictive capability of the model.
Task 6: Decision-Making
Task 6 [5%] Design an algorithm (‘agent’) that, at the end of a trading day, advises Melanie on whether to buy, sell or hold the stocks. The objective of the agent is to maximise its profits, namely, the difference between its initial budget and the final budget (i.e., the budget on the 1st of April 2023). The initial budget of the agent is 10000$. The agent should take as an input the stock movements in the previous n days and return a scalar specifying how many stocks to buy or sell. Choose n appropriately and justify the choice. You can even consider all the previous movements up to the current time t. A negative number qualifies a sell operation, a positive number a buy operation, and 0 keeps the current portfolio as it is. For example, an action equal to 50 means buy 50 stocks at the current market price and an action equal to −20 means sell 20 stocks at the current market price.
You can use any of the financial indicators you analysed in Task 4 to make informed decisions. We assume market movements to be stationary such that the agent’s decisions do not impact future dynamics.
Task 7 (Optional): Reporting Mini-case Study
In this task, you should provide a response to the mini-use case of the week you were assigned to. You are allowed to make improvements to the (initial) response you posted on Moodle, if any. However, ensure to (re)post the final response on Moodle and remove the previous one (if any), before the submission deadline. Your response should be added as an Appendix in the draft in the following format:
Appendix
Mini-Case Study Week X
Exact response posted on Moodle: < your response >
4 Deliverables
4.1 Report
The report should be written in the form of an academic paper using the following template (both Latex and MS Word templates) in DAPS assignment kit (DAPS assignment kit.zip)


 . The criteria for each part are detailed in the template. For beginners in Latex, we recommend Overleaf, which is a free online Latex editor.
Once you finish your report, please export it into a PDF document and name it in the following format (Using your SN number):
Report DAPS 23-24 SN12345678.pdf


The paper should be at most 8 pages long excluding references, with an additional maximum of 2 pages for references. The paper must include the following sections:
. Abstract. This section should be a short paragraph (300 words) that summarizes your report, including the problem, the methods used, the produced results and the key insights.
. Introduction. This section describes the problem with an emphasis on the motivations and the end goal. Please give this introduction the appropriate emphasis; be short but impactful with a clear description of the context and also your project understanding.
. Data Description. This section details the data that was used for this study. For each data set, should clearly describe the content, size and format of the data. The reason for selecting each data set should also be provided in this section.
. Data Acquisition. This section presents the data acquisition process, explaining how each data set was acquired, and why you chose the specific data acquisition method.
. Data Storage. This section explains and justifies your data storage strategies.
. Data Pre-processing. This section should describe in detail all the preprocessing steps that were applied to the data. A justification for each step should also be provided. In case no or very little preprocessing was done, this section should clearly justify why. Ensure that you provide clear motivation and explanations for your reasoning.
. Data Exploration. This section should summarize any data exploration task you used to find particular patterns within the data. Strong emphasis will be given the to justification and the reasoning that you applied in this phase.
. Forecasting. This section should first describe the inference problem, then explain and justify the methodology used to approach the problem and finally present the results.
. Decision-Making. This section should first describe the objective of the agent, the rationale behind the decision making strategy that you devised and finally present the results.
. Conclusion. This last section summarises the findings, highlights any challenges or limitations that were encountered during the study and provides directions for potential improvements. Please frame your conclusions around the main findings. What should you learn from the inference? What is the actual conclusion of your study?
Please make sure you complement your discussion in each section with relevant equations, diagrams, or figures as you see fit. Note that your work will be evaluated based on the report alone and comments in the code will not contribute to the narrative. Information not appearing in the report cannot be deduced, so please provide reasoning and motivation behind each step.
[IMPORTANT NOTE] Figures need to be readable, detailed in each part, clear, well-formatted, and well-commented to be considered. Figures, on their own, do not serve as conclusive evidence. They should be viewed as supplementary materials used to substantiate claims made in the main text.
4.2 Code
In addition to the report, you should also provide all the code that was used for your study. The assignment will be released using GitHub Classroom, as we have shown in the formative assessments throughout the course. In the repository, you will find:
. A version of the assignment brief in a README.md file for your convenience. In the case of ambiguities, the present manuscript takes priority.
. Empty environment.yml and requirements.txt files, which you should fill with the details of the conda environment and the pip packages required to run your code.
. An empty main.py file, which is the file we will run to check for reproducibility.
The code you submit must be:
. Reproducible. To promote fair and equal code scoring, the code marking procedure is automated and runs without interventions from staff, except for checking its outputs and reporting them. Do not expect any manual intervention from the scorer, such as manually downloading a library or moving files around. The code must not request manual inputs, and must not pause its execution; for example, it should not pause to display plots (do not use plt.imshow()), but should instead save a plot image to disk). The automated procedure will:
1. Clone your repository from scratch.
2. Run the command conda env create -f environment.yml
3. Use pylint to analyse your code
4. Run the command python main.py to check for reproducibility.
The code will be considered reproducible if a) the automated procedure succeeds and b) the code returns the same results included in the report. For more details on the exact commands run by the workflow, please take a look at the .github/workflows/score.yml file in your repository.
. Documented. We will evaluate the quality of the documentation against section 3.8 of the Google Python Style Guide.
. PEP8 Compliant. We will evaluate the quality based on the PEP8 style guide. You can use formatting tools like blackto write compliant code and linting tools like pylintto check for compliance. Please, if time complexity is not an issue, aim for readability and clarity when writing your code.
. Well organised. Organise your code following the guidelines we provided during the course. Aim at not repeating yourself, and at grouping together methods and classes that are shared across tasks. You are free to choose the criteria to organise your code, as long as the choices are justified.
. Version controlled. Use GitHub to submit your code following the best practices suggested in the course. Prefer modular commits to one big final commit, and aim at pairing each commit with a specific purpose, e.g. “add module to acquire data” . For a reference on a good commit strategy please refer to Conventional commits.
5 Marking Scheme & Submission Instructions
5.1 Marking Scheme
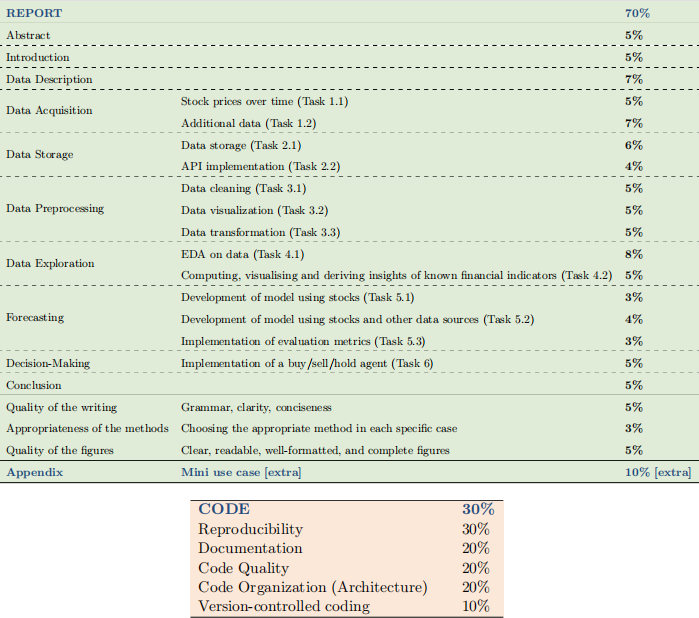
The final mark will be decided based on the report (70% of the final mark), the corresponding code (30% of the final mark), and the mini-case study (extra 10%). The final mark will be capped at 100%. In particular, we will mark based on the following scheme:
WARNING: AI tools such as ChatGPT can be used in an assistive role only for the correction of grammar or spelling errors. Ideally, please consider using Grammarly instead. Any other use is strictly prohibited, including the following uses, and will penalize your report:
. drafting or creating content;
. reframing content (except if these are grammar or spelling errors corrections);
. developing code/solutions to assigned tasks;
. answering assignment questions/tasks and providing explanations.
In case you use ChatGPT or any other language model, you MUST acknowledge it per UCL guidelines.
GitHub Copilot and language models specialised in writing code can also be used in an assistive role, but you MUST acknowledge it as per UCL guidelines.
5.2 Submission
When accepting an assignment, you will not only receive a personal repository, but GitHub Classroom will also open a Pull Request (PR) for you. To submit your assignment, please merge your pull request. Once the assignment is submitted, that is, once the pull request is merged, the assignment cannot be modified. Make sure to merge your pull request only when you are sure you want to submit your work.
Report Submission Upload a PDF version of your report on Moodle via the “ELEC0136 Assignment (Report) Submission” page.
2023-12-20