Final exam 2023
Hello, dear friend, you can consult us at any time if you have any questions, add WeChat: daixieit
Final exam
l Please carefully read the problem outlined below and submit your code as a solution.
l Utilize markdown in IPYTHON to sequentially number and provide the corresponding code for each answer.
l Note that this task is to be completed as a closed book, closed note exercise.
l The use of the internet is strictly prohibited, although you may access the help menu.
1. The given dataset, named ‘house_train’, has ( ) samples and ( ) variables. Fill out the blanks.
2. Which variables have missing entries?
3. Remove all the variables including missing entries.
4. Add a column, ‘Age’, whose value is equal to YrSold — YearBuilt.
5. Please make a histogram to show the distribution of ‘SalesPrice’. Explain it.
6. Please make a figure to check the association between ‘Age’ and ‘SalesPrice’. Explain it.
7. Please make a figure to check the association between 'CentralAir' and ‘SalesPrice’. Explain it.
8. Conduct a proper statistical hypothesis test to check whether 'CentralAir' and ‘SalesPrice’ are related (Use α = 0.05).
9. Select the following input features and target variable and rename the features and target as X and y, respectively.
features = ['CentralAir', 'LotArea', 'OverallQual', 'OverallCond',
'1stFlrSF', '2ndFlrSF', 'BedroomAbvGr', 'Age']
target = 'SalePrice'
10. Standardize the values of the features.
11. Please change the data type of ‘CentralAir’ as integer as follows:
|
CentralAir = {'N':0, 'Y':1} |
12. Split X and y into training and test dataset and fit a linear regression model using the training dataset. Write down the equation of the fitted regression model.
13. Which one seems to be the most important to the target variable among the features of X based on their correlation coefficient?
14. Please compute R2 of the fitted model. Explain it.
15. Interpret the regression coefficient of 'CentralAir'.
16. Evaluate the performance (i.e. Root Mean Squared Error) of the fitted model using testing dataset.
(Q17~19) Fill out the blanks.
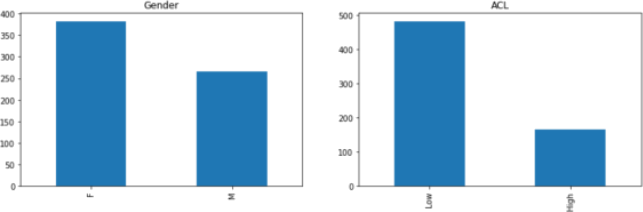
fig, (1) = plt.subplots(1, (2), figsize=(14,4))
student['gender'].value_counts().plot(kind='bar', ax=axes[0], title='Gender')
student['acl'].value_counts().plot(kind='bar', ax=axes[1], title=(3))
plt.show( )
17. Fill out the blank (1)
1) ‘acl’
2) 2
3) ax
4) None of the above
18. Fill out the blank (2)
1) ‘acl’
2) 2
3) ax
4) None of the above
19. Fill out the blank (3)
1) ‘acl’
2) 2
3) ax
4) None of the above
20. A Chi-squared test for independence was conducted on a dataset to investigate whether there is an association between gender (Male or Female) and loan approval status (Approved or Denied). Given this information, which of the following statements is true?
|
table_Gender = pd.crosstab(data['Loan_Status'], data['Gender']) stats.chi2_contingency(table_Gender) |
|
Chi2ContingencyResult(statistic=1.6495637942018446, pvalue=0.19901831142812107, dof=1, expected_freq=array([[ 26.51666667, 121.48333333], [ 59.48333333, 272.51666667]])) |
1) The p-value is less than 0.05, indicating a strong evidence against the null hypothesis, thus suggesting a significant association between 'Loan_Status' and 'Gender'.
2) The p-value is greater than 0.05, which provides insufficient evidence to reject the null hypothesis, indicating no significant association between 'Loan_Status' and 'Gender'.
3) The expected frequencies indicate that males are more likely to have a 'Loan_Status' of Yes than females, showing a clear gender bias in loan approval.
4) Given the degrees of freedom is 1, the Chi-squared statistic does not follow a Chi-squared distribution, and therefore the results are invalid.
2023-12-20