BIOS E-40: Home assignment #4
Hello, dear friend, you can consult us at any time if you have any questions, add WeChat: daixieit
BIOS E-40: Home assignment #4
Due on November 29, 2023 (course website)
(No late assignment will be accepted).
PART I: UNDERGRADUATE AND GRADUATE STUDENTS (40 PTS)
Giardia intestinalis is one of the most widespread intestinal protozoan pathogens worldwide causing hundreds of thousand cases of diarrhea each year. This organism is also often described as an ancestor of eukaryotic cells that contains a membrane bound nucleus but lacks organelles such as mitochondria and peroxisomes .
Scientists studying Giardia recently cloned a gene coding for the protein IscU.
The comparison of the Giardia IscU protein sequence (G.i.) with human (H.s.) and bacterial (E.c.) sequences is presented in the alignment below .
G.i. ------MTSLQLSSTSLLQSVARFLTKKTSSDEVYSELAMQHYRTPVNI-TLDDDDEHVG
H.s. MAAAGAGRLRRVASALLLRSPRLPARELSAPARLYHKKVVDHYENPRNVGSLDKTSKNVG
E.c. --------------------------------MAYSEKVIDHYENPRNVGSFDNNDENVG
G.i. SGLVGAPACGDVMRLQIKVGDDGKISEAKFKTFGCGAAIASSSYATSLLQGKSLEEASQI
H.s. TGLVGAPACGDVMKLQIQVDEKGKIVDARFKTFGCGSAIASSSLATEWVKGKTVEEALTI
E.c. SGMVGAPACGDVMKLQIKVNDEGIIEDARFKTYGCGSAIASSSLVTEWVKGKSLDEAQAI
G.i. KNTDISDKLGLPPVKLHCSVLAEDAIRQAIDDYKRKRGSKIQVSKSS
H.s. KNTDIAKELCLPPVKLHCSMLAEDAIKAALADYKLKQEPKKGEAEKK
E.c. KNTDIAEELELPPVKIHCSILAEDAIKAAIADYKSKREAK-------
Question 1.
1) Based on the sequence alignment, are these proteins functionally related? Briefly explain. (4 PTS)
2) The first 37 amino acids of the human protein:
“MAAAGAGRLRRVASALLLRSPRLPARELSAPARLYHK” can be used to determine the intracellular distribution of this protein .
a) Determine the predicted distribution of the human protein using the software Mitofate (http://mitf.cbrc.jp/MitoFates/cgi-bin/top.cgi). (4 PTS)
b) What are the first 5 amino acids of the predicted mature protein? (2 PTS)
3) Perform the same analysis on the 50 first amino acids of the Giardia protein:
“MTSLQLSSTSLLQSVARFLTKKTSSDEVYSELAMQHYRTPVNITLDDDDEH” and on the 50 first amino acids of the bacterial protein:
“MAYSEKVIDHYENPRNVGSFDNNDENVGSGMVGAPACGDVMKLQIKVNDE”
Explain why one of the results is surprising and the other one is expected. (4 PTS)
Question 2.
The intracellular distributions of the Giardia protein IscU and the human protein were analyzed by cell fractionation. Each cell homogenate was centrifuged at low speed to separate the low-speed sediment (Pellet) from the low speed supernatant. This supernatant was then submitted to high-speed centrifugation to separate the high-speed sediment (pellet) from the cytosol (supernatant) .
1) Aliquots of the cell homogenate, the high-speed sediment and cytosol fractions from human cells were used in two enzymatic assays.
a) The first assay measures the cytochrome c oxidase activity. In this assay, the reduced cytochrome c is added to each fraction and the decrease in absorbance at 550 nm is proportional to cytochrome c oxidation. This oxidation is catalyzed by cytochrome c oxidase and the decrease in absorbance at 550 nm is proportional to the amount of cytochrome c oxidase contained in the tested fraction. The result of the assay is presented in Figure 1.
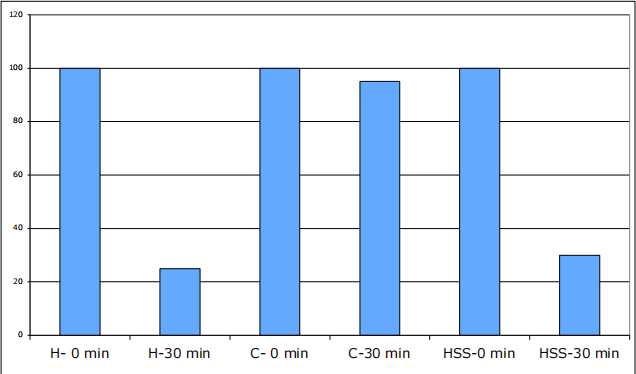
Figure 1: Cytochrome c oxidase activity. The absorbance at 550 nm was measured for each fraction immediately (0 min) and half-an-hour (30 min) after the addition of reduced cytochrome c. H: cell homogenate; C: cytosol; HSS: high-speed sediment.
Based on this enzymatic assay, predict the intracellular distribution of the human protein (Hint: you can find more information of proteins responsible for the cytochrome c oxidase activity in the Uni-Prot database. For example, check the protein COX1 with the accession number: P00395). (6 PTS)
b) The purpose of the second enzymatic assay is to measure the activity of an enzyme called lactate dehydrogenase (LDH). LDH is a glycolytic enzyme that converts pyruvic acid into lactic acid. In this assay, cell fractions were mixed with pyruvic acid and NADH (reaction co-factor). 2,4-dinitrophenylhydrazine is added immediately to half of the reaction mixture whereas the other half of the reaction mixture is incubated for 60 min at 37°C before the addition of 2,4-dinitrophenylhydrazine. Pyruvic acid reacts with 2,4-dinitrophenylhydrazine to form a highly-colored phenylhydrazone. The quantity of phenylhydrazone found in the reaction mixture is proportional to the solution absorbance at 550 nm. The results of the assay are presented in Figure 2.
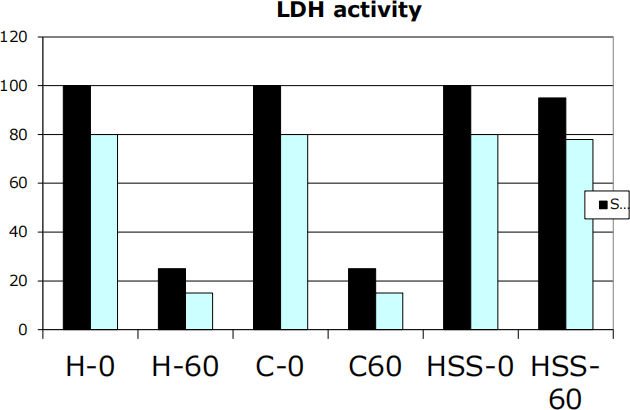
Figure 2: The LDH activity of various cell fractions was tested by measuring the amount of phenylhydrazone at times 0 and 60 min. The tested fractions were the cell homogenate (H), the cytosol (C), and the high-speed sediment (HSS) from human cells (series 1: black bars) and from Giardia cells (series 2: blue bars) .
Briefly explain these results and answer the following question: What does this assay tell you about the purity of the HSS fractions? (6 PTS)
c) What is the likely intracellular organelle found in the HSS fraction from human cells? (4 PTS)
2) The distribution of the protein IscU was analyzed by immunoblots. Giardia cells engineered to express a human mitochondria protein (mtHsp70) were fractionated as described before. The protein content of each fraction was resolved by SDS-PAGE and transferred onto membranes. One membrane was probed with an antibody directed against IscU and another membrane was probed with antibodies directed against mtHsp70. The results are presented in figure 3.
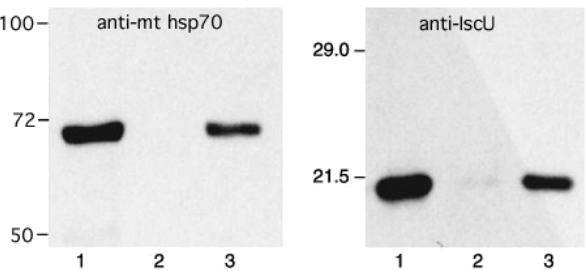
Figure 3: Immunoblot showing the distribution of mthsp70 (left) and IscU (right) in Giardia. The following fractions were tested: cell homogenate (lanes 1), cytosol (lanes 2) and high-speed sediment (lanes 3) .
a) What surprising conclusion can you draw from the results presented in Fig. 3? (4 PTS)
b) In light of this result, explain the importance of the LDH assay presented in Figure 2. (4 PTS)
c) If you increase the resolution of the SDS-PAGE, would you detect any molecular weight difference between IscU present in lanes 1 and 3? Explain. (2PTS)
GRADUATE STUDENTS ONLY (40 PTS)
A genetic approach can be used to identify mitochondrial proteins. Recently scientists described such a method based on a reporter gene assay combined with a protein splicing approach.
Background information:
Reporter gene assay: to determine the intracellular distribution of a protein you can introduce in cells a gene coding for a fusion protein containing an easily detected moiety fused to the portion of the analyzed protein that may be responsible for its intracellular distribution. For example, you can fuse the sequence coding for the green fluorescent protein (GFP) with the sequence coding for a mitochondrial targeting signal (MTS) .
Upon introduction of this gene into a cell, the fusion protein MTS-GFP will be synthesized and MTS will drive its accumulation into mitochondria. Furthermore, the distribution of fusion protein will be easily visualized by fluorescence microscopy.
Protein splicing: few years ago, scientist found that the coding sequence for 2 distinct halves of a protein were found in two distinct genes. For example, gene A codes for the N-terminal portion of the protein plus a small C-terminal tag that is not found in the final spliced protein, and gene B codes for the C-terminal portion of the protein plus a small N-terminal tag that is not found in the final spliced protein. In the cell, a chemical reaction occurs between the N and C-terminal tags that result in a fusion of the two tagged proteins with the elimination of both tags and the production of a native spliced protein. One can use the process of protein splicing to reconstitute a functional protein . For example, figure 1 shows the reconstitution of EGFP (form of GFP optimized for eukaryotic cells) using protein splicing.
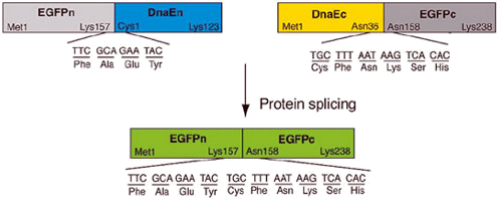
Figure 1: Reconstitution of active EGFP by protein splicing.: domain structures of DnaE-tagged EGFP before and after protein splicing, showing sequences of the boundaries between DnaEn and EGFPn, between Dnac and EGFPc, and between EGFPn and EGFPc. The letters n and c refer to the N-terminal and C-terminal portions of proteins respectively.
Question1.
A cell line called L1mito was created by infecting L1 cells with the retrovirus pMX-MTS/Dec (Neo) described in Figure 2. Upon infection, retroviruses integrate their genome in the genome of the host cell. The viral genome contains a gene coding for MTS-DnaEc-EGFPc. This protein is targeted to the mitochondria of infected cells and contains the non-fluorescent C-terminal portion of EGFP. The virus also contains a gene named neo whose product confers resistance neomycin .
1) Explain how do you create a permanent cell line expressing MTS-DnaEc-EGFPc with the help of neomycin. (2 PTS)
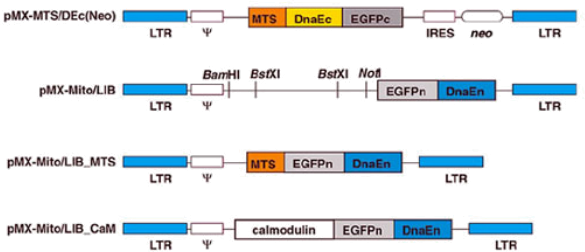
Figure 2: Schematic structure of the retroviral genomes used in this study. The LTR are long terminal repeat involved in the integration of the viral genome in the host cell genome. IRES is the internal ribosome entry site that drives the translation of the transcript coding for the neo gene. Ψ is the retrovirus-packaging signal, a sequence required for the production of retroviruses .
2) Cells infected with pMX-MTS/Dec (Neo) were incubated with TMRE, a red fluorescent reagent that accumulated in mitochondria. After the treatment, infected cells were observed by fluorescence microscopy. The mitochondria could appear red fluorescent if they contain only TMRE or green fluorescent if they contain only active EGFP. Alternatively, when mitochondria contain both TMRE and active EGFP they will appear yellow (overlay of red and green) .
What is the expected color of the fluorescent mitochondria? Briefly explain. (6 PTS)
Question 2.
1) Cells from the permanent cell line L1mito were infected with the retrovirus pMX-Mito/LIB_MTS (Figure 2) that drives the synthesis and mitochondrial targeting of the fusion protein MTS-EGFPn-DnaEn .
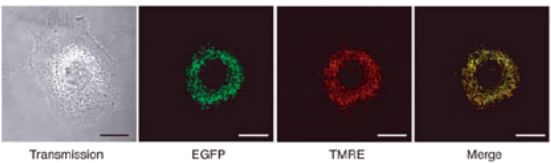
Figure 3: Cultured cells infected with pMX-Mito/LIB_MTS were observed with a fluorescent microscope. The left panel (transmission) shows the structure of the observed cell. The distribution of EGFP and TMRE is shown on the two middle panels. The right panel (merge) is the superimposition of the two middle images (Check the pdf file on the course website for the colored image) .
a) The cells were treated with TMRE and observed by fluorescence microscopy. Figure 3 shows the typical staining of a cell. Different filters are used to observe the red and green fluorescence. Therefore, distinct images are captured for each type of fluorescence and then superimposed to compare the distribution of EGFP and TMRE.
Why is fluorescent EGFP detected in mitochondria? Include the description of relevant molecular mechanisms in your brief explanation. (8 PTS)
b) Fluorescent cells can be isolated by a cell sorter. In a cell sorter, individual cells from a solution are separated and their fluorescence intensities are measured by a detector. Highly fluorescent cells are then directed to one cell receptacle whereas cells with only background fluorescence are directed to a separate receptacle. This type of analysis, called FACS analysis, can also be used to quantify the number of fluorescent cells in a population (Figure 4) .
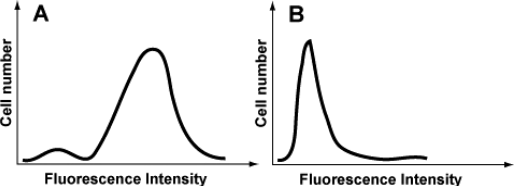
Figure 4: Results of the FACS analysis for two populations of cells. Panel A: L1mito cells were infected with the retrovirus pMX-Mito/LIB_MTS (see Figure 2) and sorted based on EGFP fluorescence. Panel B: L1mito cells were infected with the retrovirus pMX-Mito/LIB_CaM (see Figure 2) and sorted based on EGFP fluorescence. In this case, the fusion protein contains the cytosolic protein calmodulin (CaM) at its N-terminus .
How would you interpret the results presented in panels A and B? (8 PTS)
2) A retroviral library was constructed by cloning cDNA prepared with mRNA extracted from L1 cells between the BstXI restriction sites of the retroviral genome pMX-Mito/LIB (Fig. 2). Each retrovirus from this library express, X-EGFPn-DnaEn, a fusion protein contains an unknown protein X (coded by the inserted cDNA), the N-terminal portion of EGFP (coded by EGFPn) and the N-terminal portion of DnaE (coded by DnaEn) .
The experimental conditions used to infect L1mito cells with the retroviral library were chosen such that, on average, a L1mito cell is infected by a single retrovirus. Five days after infections EGFP fluorescent cells were recovered by cell sorting.
Why can you use this method to identify mitochondrial proteins? (10 PTS)
3) Imagine that you have isolated by the method described above a putative mitochondrial protein that lacks the classical mitochondrial-targeting signal. Briefly describe two experimental approaches to confirm that the identified protein accumulates inside mitochondria. (6 PTS).
2023-12-19