Coursework#3 – Assessment on JAVA and GUI Topic
Hello, dear friend, you can consult us at any time if you have any questions, add WeChat: daixieit
Scalable Cross-Platform Software Design:
Coursework#3 – Assessment on JAVA and GUI Topic
25% of the module mark.
Read the marking scheme on Moodle to familiarised with what I am looking for.
Coursework Instructions (you may be penalised if not following the instruction given):
1. Please submit as a single zip file which contains the whole NetBeans project folder and a brief report (max 8 pages).
2. Only one NetBeans project encompassing all tasks to be submitted—not separate Netbeans project for each Question.
3. The NetBeans project must be prepared using JDK v8 and JavaFX v8 and should run in my PC without modification. (how to install documents are in Moodle)
4. Graphical User Interface (GUI) will based on JavaFX v8 platform
5. The report will describe the answer for each Questions, i.e., class name and their purpose, and evidence to convince the client that it works correctly.
Document date: 20/09/2023
Context description
A well-known Aerospace company AirCoach requests you to design and implement software with a user-friendly user interface to be integrated with their optical roughness sensing device. Their plan is to use the optical roughness device to measure “how smooth” the inner-lining of the inner engine cylinder of their new flagship plane Nimbus 2023. As they found from simulation that roughness of the engine cylinder degrades the engine’s efficiency, lifetime, and increases carbon and noise emission.
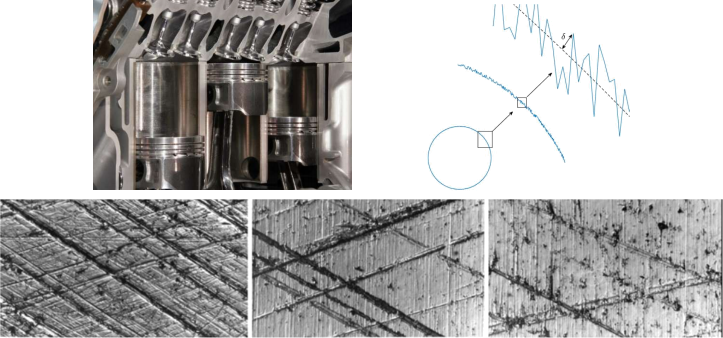
Figure 1 Illustration of the cylinder and the roughness on the surface of an engine cylinder. Page 2 of 7
Your task is to develop the accompanying software for the optical roughness device. The engineer has described that this device will output a text file which lists the roughness as the deviation δ in the unit of meter from an ideal circle (see Fig. 1).
For illustration purposes, the first few lines of such text file are given in Fig. 2,
6.000199e-05
-4.671694e-05
-1.083731e-04
-1.894823e-04
1.119588e-04
…
Figure 2 Few lines of the content of the measurement device in the unit of meter.
Specifically, your JAVA application should:
1. Has a user-friendly user interface.
2. Streaming from the text file, to have the text file as an input.
(Do not hard-coded the text file, I may test your code with different .txt file)
3. Calculate the mean, variance, median and standard deviation of δ
4. Plot the normalised histogram of the deviation δ, with an option to choose different bin method.
5. Fit and plot the histogram with a Probability Density Function model (PDF).
6. Save the histogram and the fitted PDF as a Bitmap png file.
7. The software should also display the fitting parameters. For example: α, μ and σ for Normal Probability Density Function (see Review on the mathematics 3).
This is the context of the coursework.
You will work on this coursework through a step-by-step following the Questions given in the following. Going through the Questions in-sequence will help you to start the coursework.
Mark will be given for each Questions and its corresponding Tasks.
Make sure you read the Rubric for this coursework – familiarise yourself which what is being expected from your work
Question 1: [Mark 10%]
Develop a JAVA package called binmethod which contains the implementation of Square root choice, Sturge’s and Rice rule bin rule formulae (see Review on the mathematics 1 box). The package will comprise of three concrete classes (i.e. the three bin rule formulae) and an Abstract Parent class called BinFormulae.
The client code Unit_test_binmethod.java will drive your code to compute the number of bins for different bin rule formulae.
Unit_test_binmethod.java
/*
Client code to test the binmethod package
*/
import java.util.List;
import java.util.Arrays;
// the bin rule formulae must be implemented in binmethod package
import binmethod.*;
public class Unit_test_binmethod
{
public static void main(String[] args) {
// Create array of data
List
// test SturgesFormula class
SturgesFormula SturgesInstance = new SturgesFormula(exampleData);
SturgesInstance.calculateNumberOfBins();
System.out.printf("By Sturges Formula: %d \n", SturgesInstance.getNumberOfBins());
// test SquareRootChoice class
SquareRootChoice SquareRootChoiceInstance = new SquareRootChoice(exampleData);
SquareRootChoiceInstance.calculateNumberOfBins();
System.out.printf("By Square Root Formula: %d \n", SquareRootChoiceInstance.getNumberOfBins());
// test RiceRule class
RiceRule RiceRuleInstance = new RiceRule(exampleData);
RiceRuleInstance.calculateNumberOfBins();
System.out.printf("By Rice Rule Formula: %d \n", RiceRuleInstance.getNumberOfBins());
}
}
Task 1a: Draw and discuss an UML diagram, in your report, which show the member and the relations between classes in the binmethod package.
Task 1b: Implement the classes so that the Unit_test_binmethod.java client code will drive your code. Report the evidence that your binmethod package works properly in your report.
Review on the mathematics 1
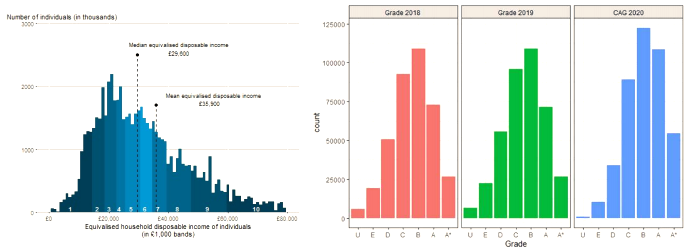
In statistics, histogram is used to present the frequency distribution of certain sampled data into several clusters. For example, the distribution of income in the country or the distribution of A-level grades.
The first step in drawing a histogram is to “bin” the data into several cluster of value marker, i.e., salary range or grade in the examples given above.
There are several ways to determine the “number of bin” and different “number of bin” may reveal different features of data. In general, a good bin should
Bins should be all the same size. See below how to calculate the bin size.
Bins should include all the data.
It is common to display histogram using different bin number which can be calculated using:
Square root choice formula
k = √n
Sturge’s formula
k = 3.3 logφЈ n + 1
Rice rule formula
k = 2√ɘ n
where, k is the number of bins, n is the total number of observation/measurement data and logφЈ () is logarithm basis-10 operator.
Question 2: [Mark 30%]
Task 2a: Develop a package named statutils which has the capability to calculate basic statistical figures (mean, variance, max, min, median and standard deviation) of data samples.
Task 2b: Add a capability to count the number of samples in each bin. Please provide description in your report, the name of member functions/objects and the underlying design philosophy to perform this task.
Task 2c: Add a capability to perform histogram normalisation (see Review on the mathematics 2 box). Please provide description in your report, your design philosophy and name of member functions/objects which perform this task in your report.
Task 2d: Write client class with a main function which perform the unit testing of the member functions, similar to the Unit_test_binmethod.java. Report the evidence that your package works properly in your report.
Task 2e: Draw and discuss an UML diagram, in your report, which show the member of the class, including their input and output arguments.
You may make several classes to perform Task 2a – Task 2d and they should all in the statutils package.
Review on the mathematics 2
A histogram show “how many times” a certain sample is observed from measurement, i.e., frequency of data. Thus, its magnitude changes depending on the total number of samples. This type-of histogram is called un-normalised histogram.
A normalised histogram, on the other hand, shows what is the probability of a certain value will be observed if there is an infinite number of samples. Mathematically, this means that the area under the curve is equal to 1. In most cases, a normalised histogram is more useful than the un-normalised histogram in representing a large sampled data as in our task.
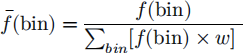
where, f(bin) and f(bin) is the normalised and unnormalised frequency, respectively.
The w denotes the width of each bin, given by
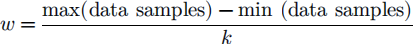
where, k is the number of bins which is calculated depending on the kind of bin method used, see Review on the mathematics 1 box.
Question 3: [Mark 10%]
Task 3a: Develop a package named mathutils in which contains a class to perform data fitting. The class will have static member functions to calculate the fitting parameters of the histogram (i.e. μ, σ, and α parameters in the Review on the mathematics 3 box). The static function will use GaussianCurveFitter class implemented within the commons-math library from Apache.
Provide evidence, in your report, that this package perform its intended task.
Review on the mathematics 3
You need a normalised histogram to fit with a Probability Density Function (PDF). In our case, Normal PDF is appropriate and is given by
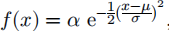
where the PDF parameters are,
α is the normalisation coefficient
μ is the centre of the PDF
σ is the width of the PDF.
There are several ways to fit the histogram to a PDF, the most well-known method is called Levenberg-Marquardt method.
Figure shows an example of an unnormalised histogram (left) and normalised with fitted Normal PDF (right).
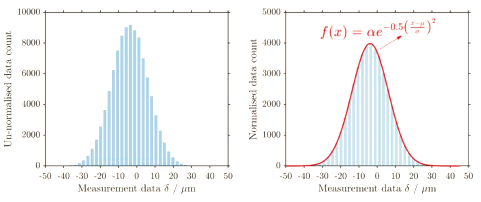
WE ARE NOT GOING INTO THE DETAIL OF MARQUARDT METHOD. IT IS QUITE MATHEMATICAL AND OUT OF THE SCOPE OF THE MODULE.
I HAVE PROVIDED A NETBEANS PROJECT IN MOODLE IN WHICH I DEMONSTRATE THE USE OF WELL-DEVELOPED OPEN-SOURCED LIBRARY FROM APACHE WHICH IMPLEMENT THE MARQUARDT METHOD. DOCUMENTATION OF THE LIBRARY CAN BE SEEN IN
http://commons.apache.org/proper/commons-math/apidocs/overview-summary.html
Question 4: [Mark 35%]
Task 4a: Develop and implement an operational Graphical User Interface application satisfying the client request:
1. Has a user-friendly user interface
2. Streaming from the text file, to have the text file as an input
3. Calculate and display the mean, variance, median and standard deviation of measurement data δ
4. Plot the normalised histogram of the deviation δ, with an option to choose different bin method.
5. Fit and plot the histogram with a Probability Density Function model (PDF).
6. Save the histogram and the fitted PDF as a Bitmap png file.
7. The software should also display the fitting parameters. For example: α, μ and σ for Normal Probability Density Function (Review on the mathematics 3).
Task 4b: Draw the hierarchical order of the GUI nodes.
Task 4c: Draw and discuss the GUI Event Handling UML diagram (aka sequence diagram) of your app.
Good Programming Practice - [Mark 15%]
Detail on expected good programming practice is given in the rubric
2023-12-18